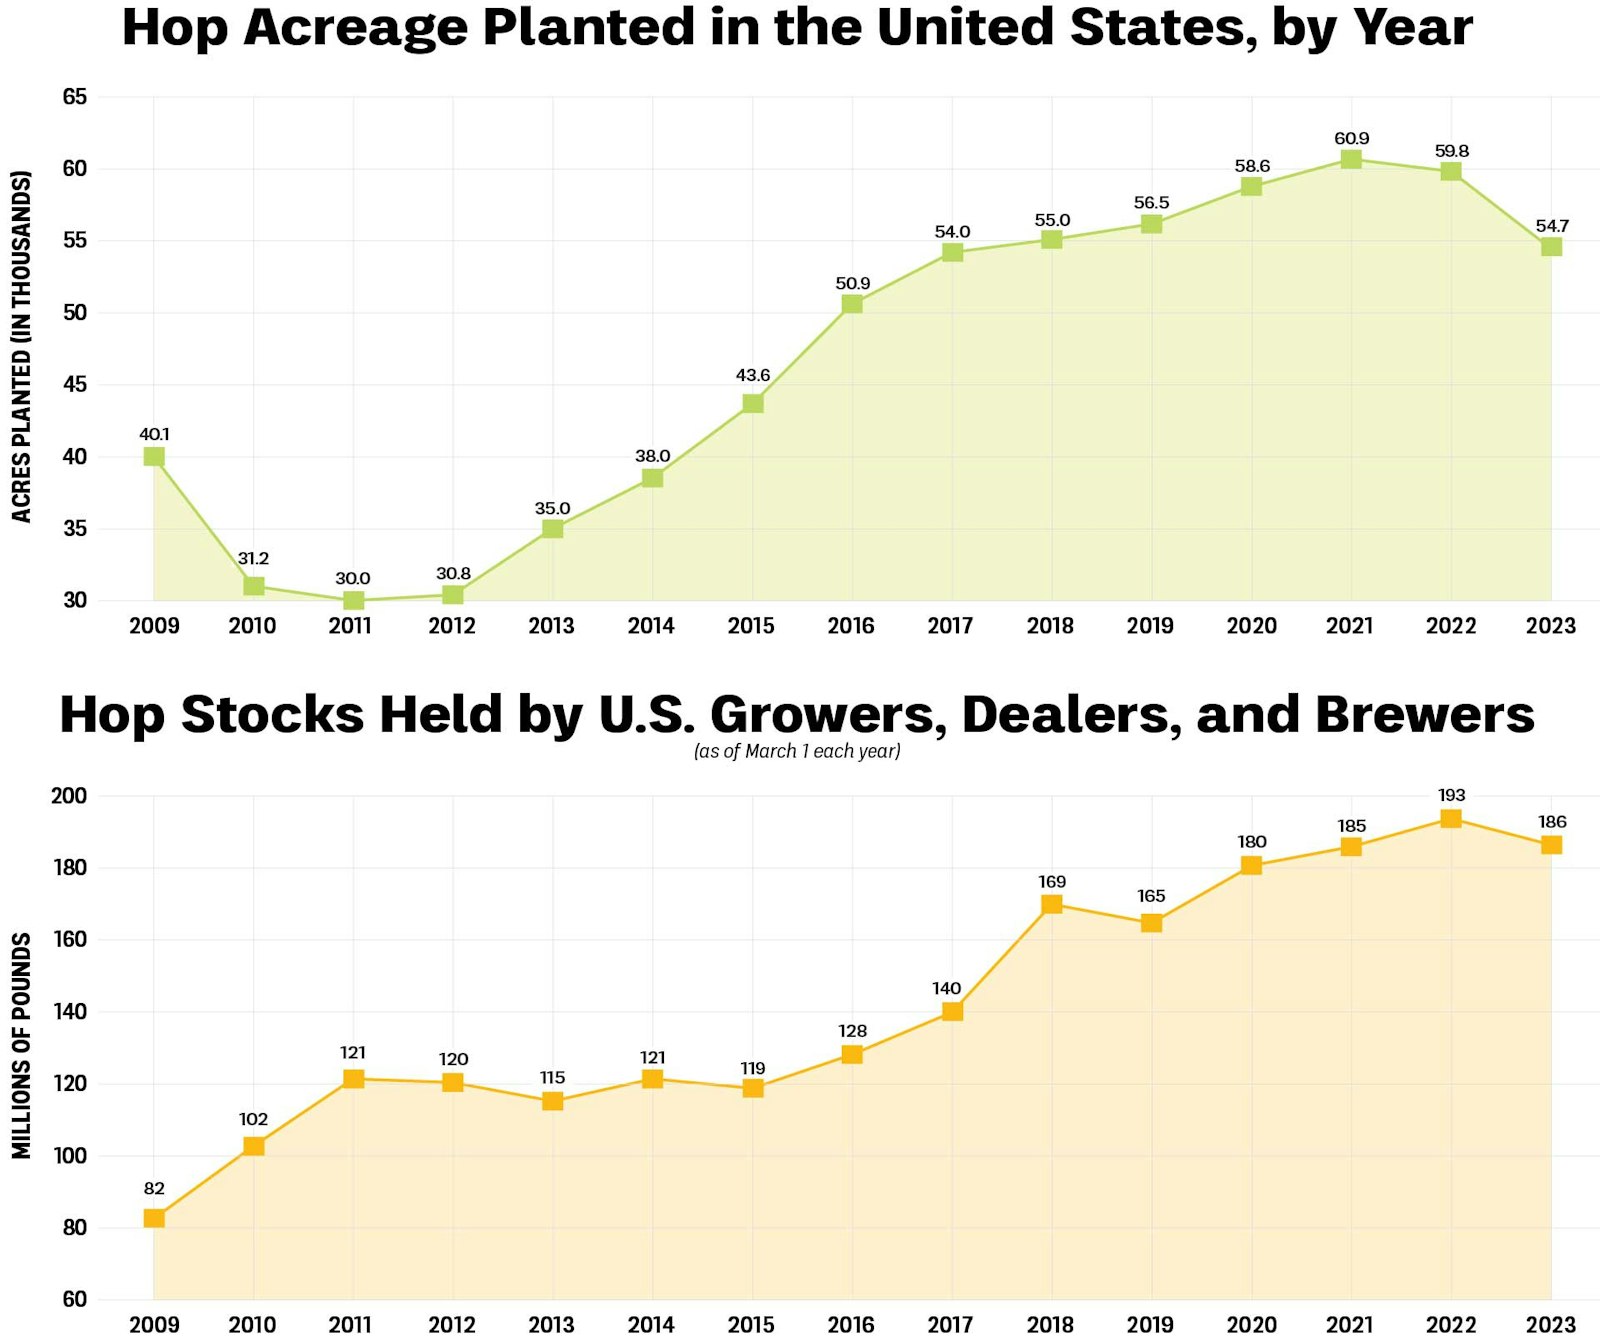
Each year, the U.S. Department of Agriculture tracks how many acres of hops are planted by U.S. farmers, along with the amount of unused hops currently being held by growers, dealers, and brewers. This year, growers reduced acreage by about 8.5 percent, reflecting a consensus that supply is outpacing demand. Here, we plot the past 15 years of acreage ups and downs, along with the USDA’s graph of hop stocks over the same time period.
For more on the challenge of managing the surplus, see our Hops Insider articles on Decoding and Rightsizing the hop market.
Source: USDA-NASS, nass.usda.gov