
For the general consumer, color can be a quick and dirty way of deciding which beer to try—as in, “I like pale beers,” or “I like dark beers.” For the brewer, however, there’s much more to consider.
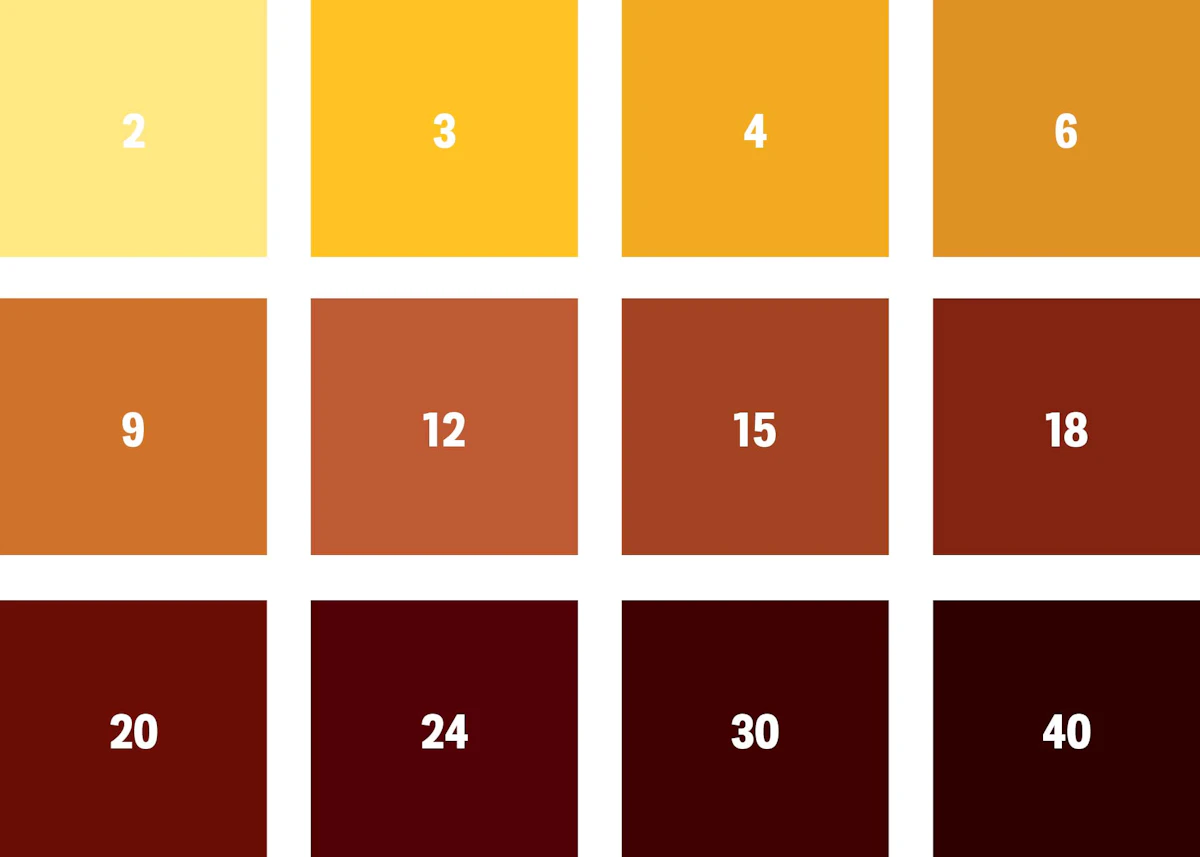
In the brewing industry, the most important method we use to measure beer color is known as the standard reference method, or SRM. It’s a generic term that essentially refers to how brewers measure and describe the color of their beers. The scale goes from about 2—denoting a pale straw color—all the way up to 40, which refers to a deep brown or black color.
The ingredients in a recipe—especially the amounts and proportions of different grains—directly impact the color. A grist that’s mostly base malt, with little or no roasted grains, will have a lower SRM number. As the volume of modified grains and the level of modification increase, that SRM number increases and the beer appears darker. Malts with higher roasting times and temperatures contribute the darkest colors to beer.
Most brewers are familiar with those basics. Color seems like such a simple thing to measure, so why should the brewer care enough to invest in equipment and perform a test to get a more quantitative breakdown?
Let’s dive deeper and consider the why and how.
Drinking with Our Eyes
To start, your beer’s visual aspect is the first sensory experience the consumer has with your product.
If your pale ale is amber-colored and murky, the consumer might find that unappealing and ask for a different beer, or none at all. That also plays into the consistency of your brand: Quality is table stakes these days, as the saying goes, so brewers are striving more and more to reach a high standard—but consistency is what will take your beer to the next level.
A customer who comes back to one of your beers expects to re-create the same sensory experience that they had the first time they tried it. An attribute such as color can shift so incrementally—for example, as raw materials inevitably change—that the brewer might not notice that shift over time. That can happen when you’re too close to the product, not able to see these small changes. However, an observant customer who hasn’t visited the taproom in a couple of months could take note.
Consider an Oktoberfest that’s gone through some subtle recipe changes over time, and the SRM ever-so-gradually drifts from a beautiful pale amber to a deep brown. It’s not only customers who might notice; if you enter that beer in competitions, judges might decide the color has shifted out of style—visual attributes are typically the first thing a judge notes. In a flight of eight other beers of the same style, that initial visual experience could be enough to knock a beer out of the running if it doesn’t adhere closely enough to the specified style guidelines.
Brewers hate to get competition notes back with comments such as, “quality example, but was outperformed.” Sometimes that can come down to something as simple as the beer’s color pushing the limits of the guidelines—a real bummer when you know your beer excels in other aspects.
What SRM Really Measures
The SRM score isn’t just based on eyeballing a color chart—there is a scientific definition. Ready for it?
According to the American Society of Brewing Chemists (ASBC), “beer color intensity on a sample free of turbidity is 12.7 times the absorbance of a 1-cm cell measured spectrophotometrically at a wavelength of 430 nm and is reported as standard reference method (SRM) units.” Oof, that’s pretty technical. So, let’s break it down further, starting with the measurement method.
The instrument used in this test is known as a spectrophotometer. This device measures the interaction of light with the beer sample—more specifically, we’re seeing how much light the sample absorbs. The darker the sample is, the greater the amount of light that’s absorbed, and the higher the SRM number.
“Free of turbidity” means that we want a sample that isn’t hazy or murky because that can cause the SRM number to be higher than the actual color. Particles such as those that make beer hazy absorb more light, so your hazy IPA might get a reading closer to a stout. Filtering or centrifuging the sample before testing for SRM will ensure that haze doesn’t impact the final number.
How about the “1-cm cell” detail? That’s called a cuvette, and it’s a glass rectangle that holds the beer sample in the light path of the spectrophotometer. With most spectrophotometers, you’ll get a reading of absorbance that needs to be multiplied by 12.7 to get the corresponding SRM number. Some spectrophotometer units are designed specifically with beer in mind, and these have an SRM program that automatically gives you the value in SRM units. (If not, it’s a pretty easy calculation to plug into your Excel data-tracking sheet.)
Finally, we’re measuring at 430 nm (or nanometers), which is in the visible light spectrum. Not so bad, once we break everything down!

Testing for SRM in the Brewery
To get started with testing for SRM, you’ll have to invest in a spectrophotometer, which can range anywhere from $1,500 to $10,000.
Clearly, that’s an expensive piece of equipment for a small brewery to purchase for just one type of test. However, if you get the right type of spectrophotometer, you can use it for other quality tests, too. Before buying a unit just for SRM, think ahead about the value of testing for IBUs or diacetyl precursors (vicinal diketones, or VDK) in your brewery.
Equally important but much less expensive are the cuvettes. As I mentioned above, these are what hold the samples so they can be placed inside the spectrophotometer for reading. In the case of SRM measurement, glass cuvettes are the material of choice for testing at this wavelength. Proper cleaning and regular replacement of your cuvettes will ensure that your results aren’t skewed by scratches or discolored sample cells.
Other good investments include Kimwipes, for carefully cleaning the cuvettes, and transfer pipettes, for getting your beer samples into the cuvettes. If you plan to measure the color of hazy beers, then you should also consider filtration or centrifuge materials.
Now comes the easy part: measuring your sample. When it comes to beer testing, SRM is one of the simplest tests you can do once you have all the equipment in house. Here are the basic steps:
- To start, zero the spectrophotometer with distilled water, which gives the instrument a zero point for comparison with the beer sample.
- Next, rinse the cuvette with the beer sample to be measured. That ensures that there isn’t any water dilution or other residue present in the cuvette.
- Fill the cuvette to just below the top, ensuring that no bubbles are present. As do haze particles, bubbles get in the way of the light beam and cause inaccurate results.
- Finally, use a Kimwipe to clean the outside surface of the cuvette. Any smears or oils on the outer surface will also potentially skew your results.
- Place your beer-filled cuvette in the sample slot, close the lid, and hit measure at 430 nm. You should get an absorbance reading that you can then multiply by 12.7 to get your SRM value.
All in all, once the spectrophotometer is warmed up and running, this test takes only about five minutes per sample.
Making the Most of the Measurements
As with most things related to quality control, data tracking and regular analysis are what will allow you to get the most out of your testing. (For much more on the value of tracking data in the brewery, see “Your Brewery’s Most Valuable By-Product? Its Data.”
You should test every finished beer for SRM. While that might seem like overkill for such a simple aspect of beer, it becomes more important as you begin to track the data on your brands. The more data points you have, the better and more reliable your data will be. I recommend saving one can from each run specifically for SRM testing. You can do this test in batches, so you aren’t firing up the spectrophotometer for just one sample at a time.
What can you expect to learn from this data, once you begin to compile it? As I mentioned above, you’ll be able to track the color of your beers by batch. That can show you whether one particular batch is an outlier, which might trigger an investigation into why that batch is different from the others. You can also use your data to track any long-term drifts in SRM, which can be difficult to detect through daily visual inspection of the beer. That can be the result of recipe changes or new malt lots or suppliers. Being able to have a visual representation of that in graph form goes a long way when it comes to interpreting these data.
All in all, measuring SRM ends up being a simple test, even if the price tag up front can be expensive. As with most quality-control tests in beer, that initial investment typically pays off in the long run.
The first thing about your product the consumer experiences is how it looks. By consistently measuring SRM, you ensure those visuals consistently meet expectations, which helps make your customers’ experience that much better.