Infographic: On- and Off-Premise Sales Trends
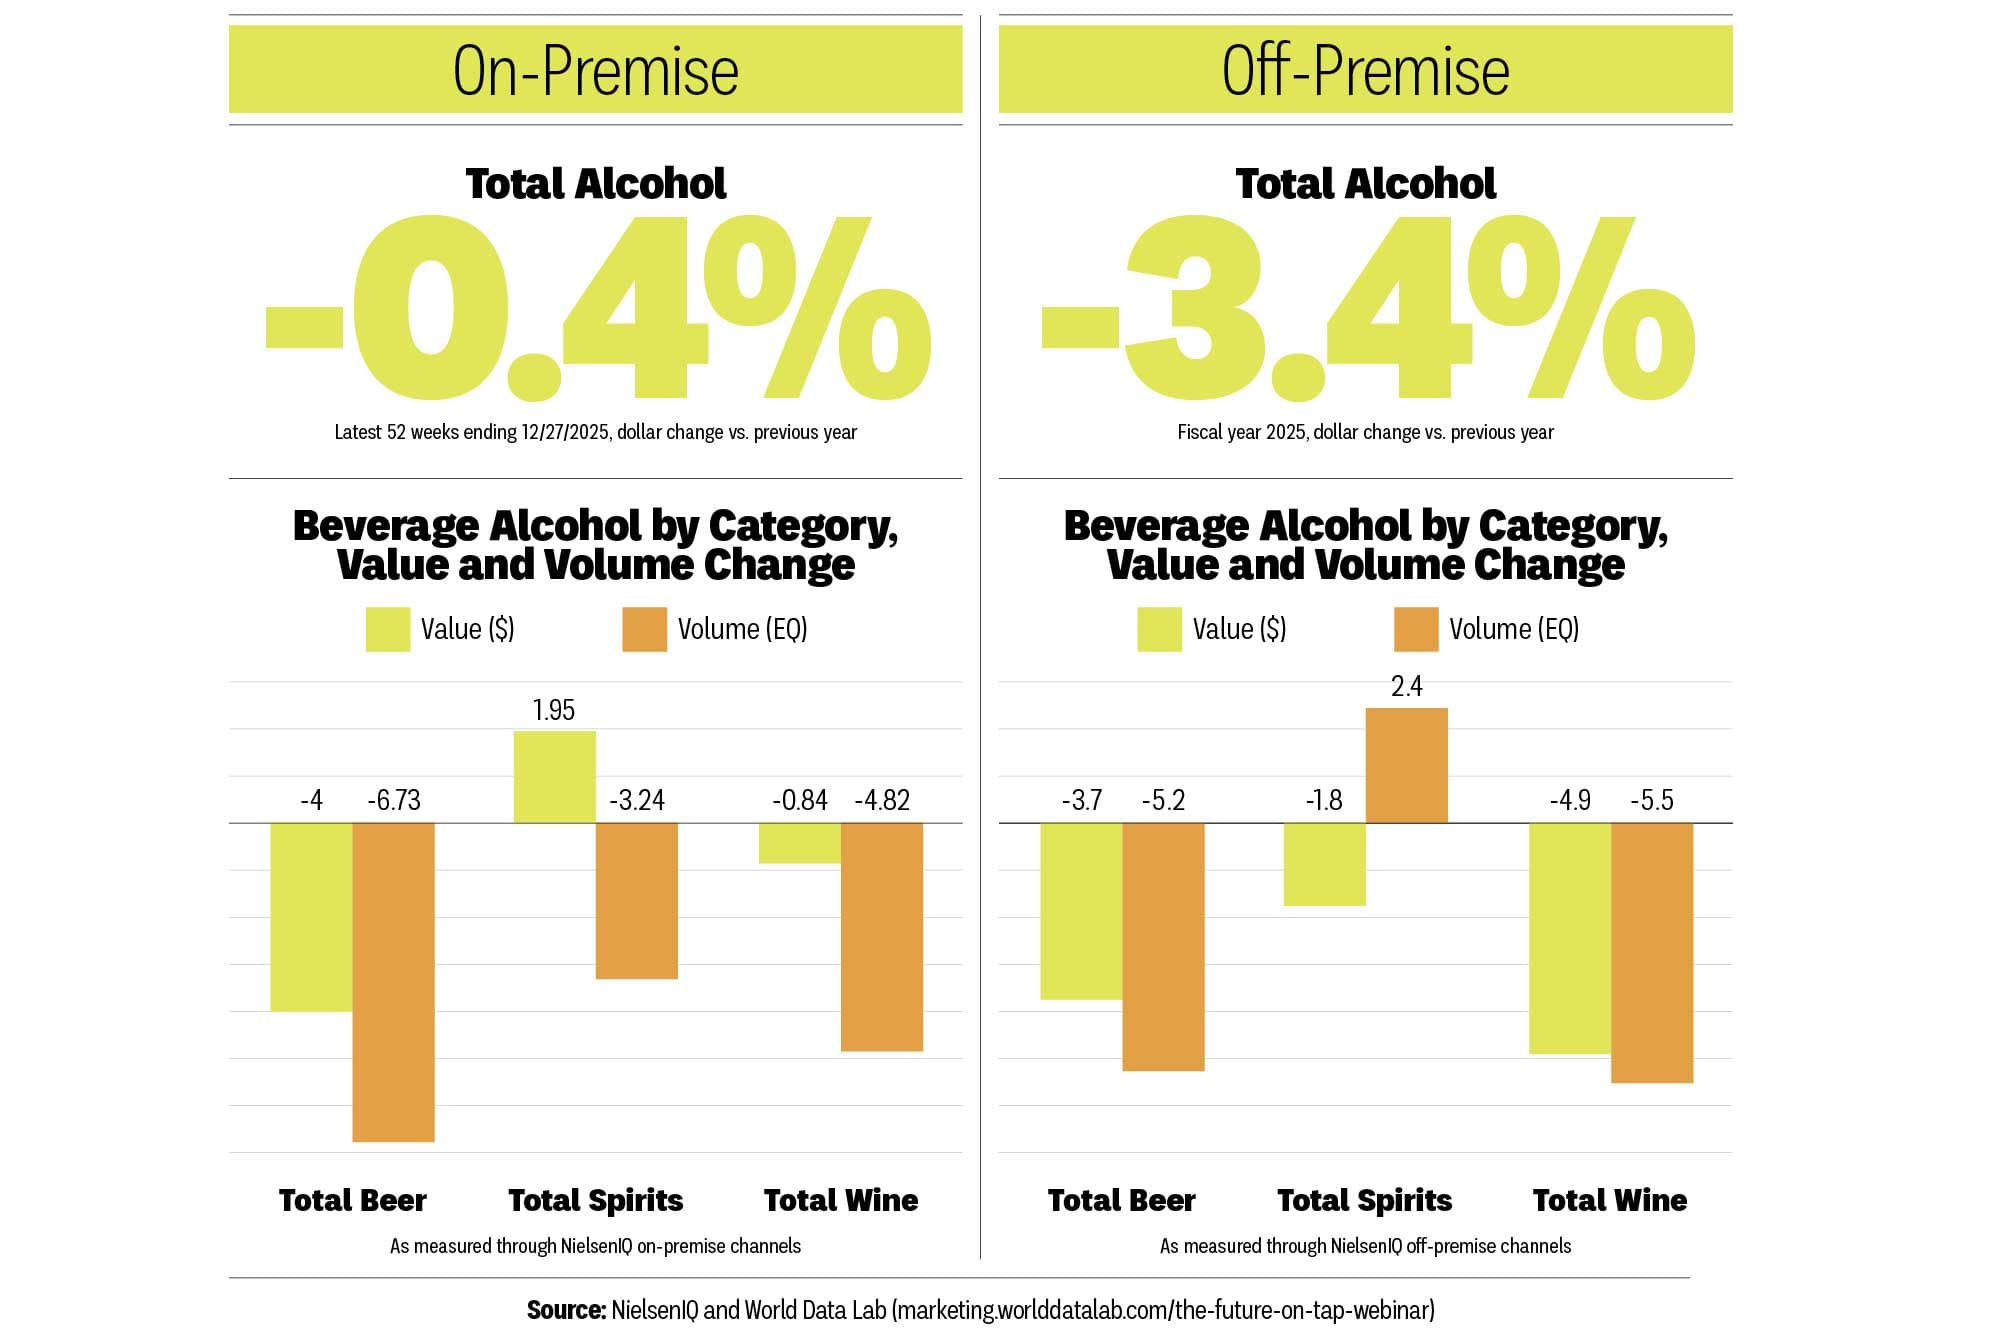
Last year was another tough one for beer sales, though there’s been a gap between retail and on-premise sales. Let's take a high-level look.
40 articles in this category
Last year was another tough one for beer sales, though there’s been a gap between retail and on-premise sales. Let's take a high-level look.
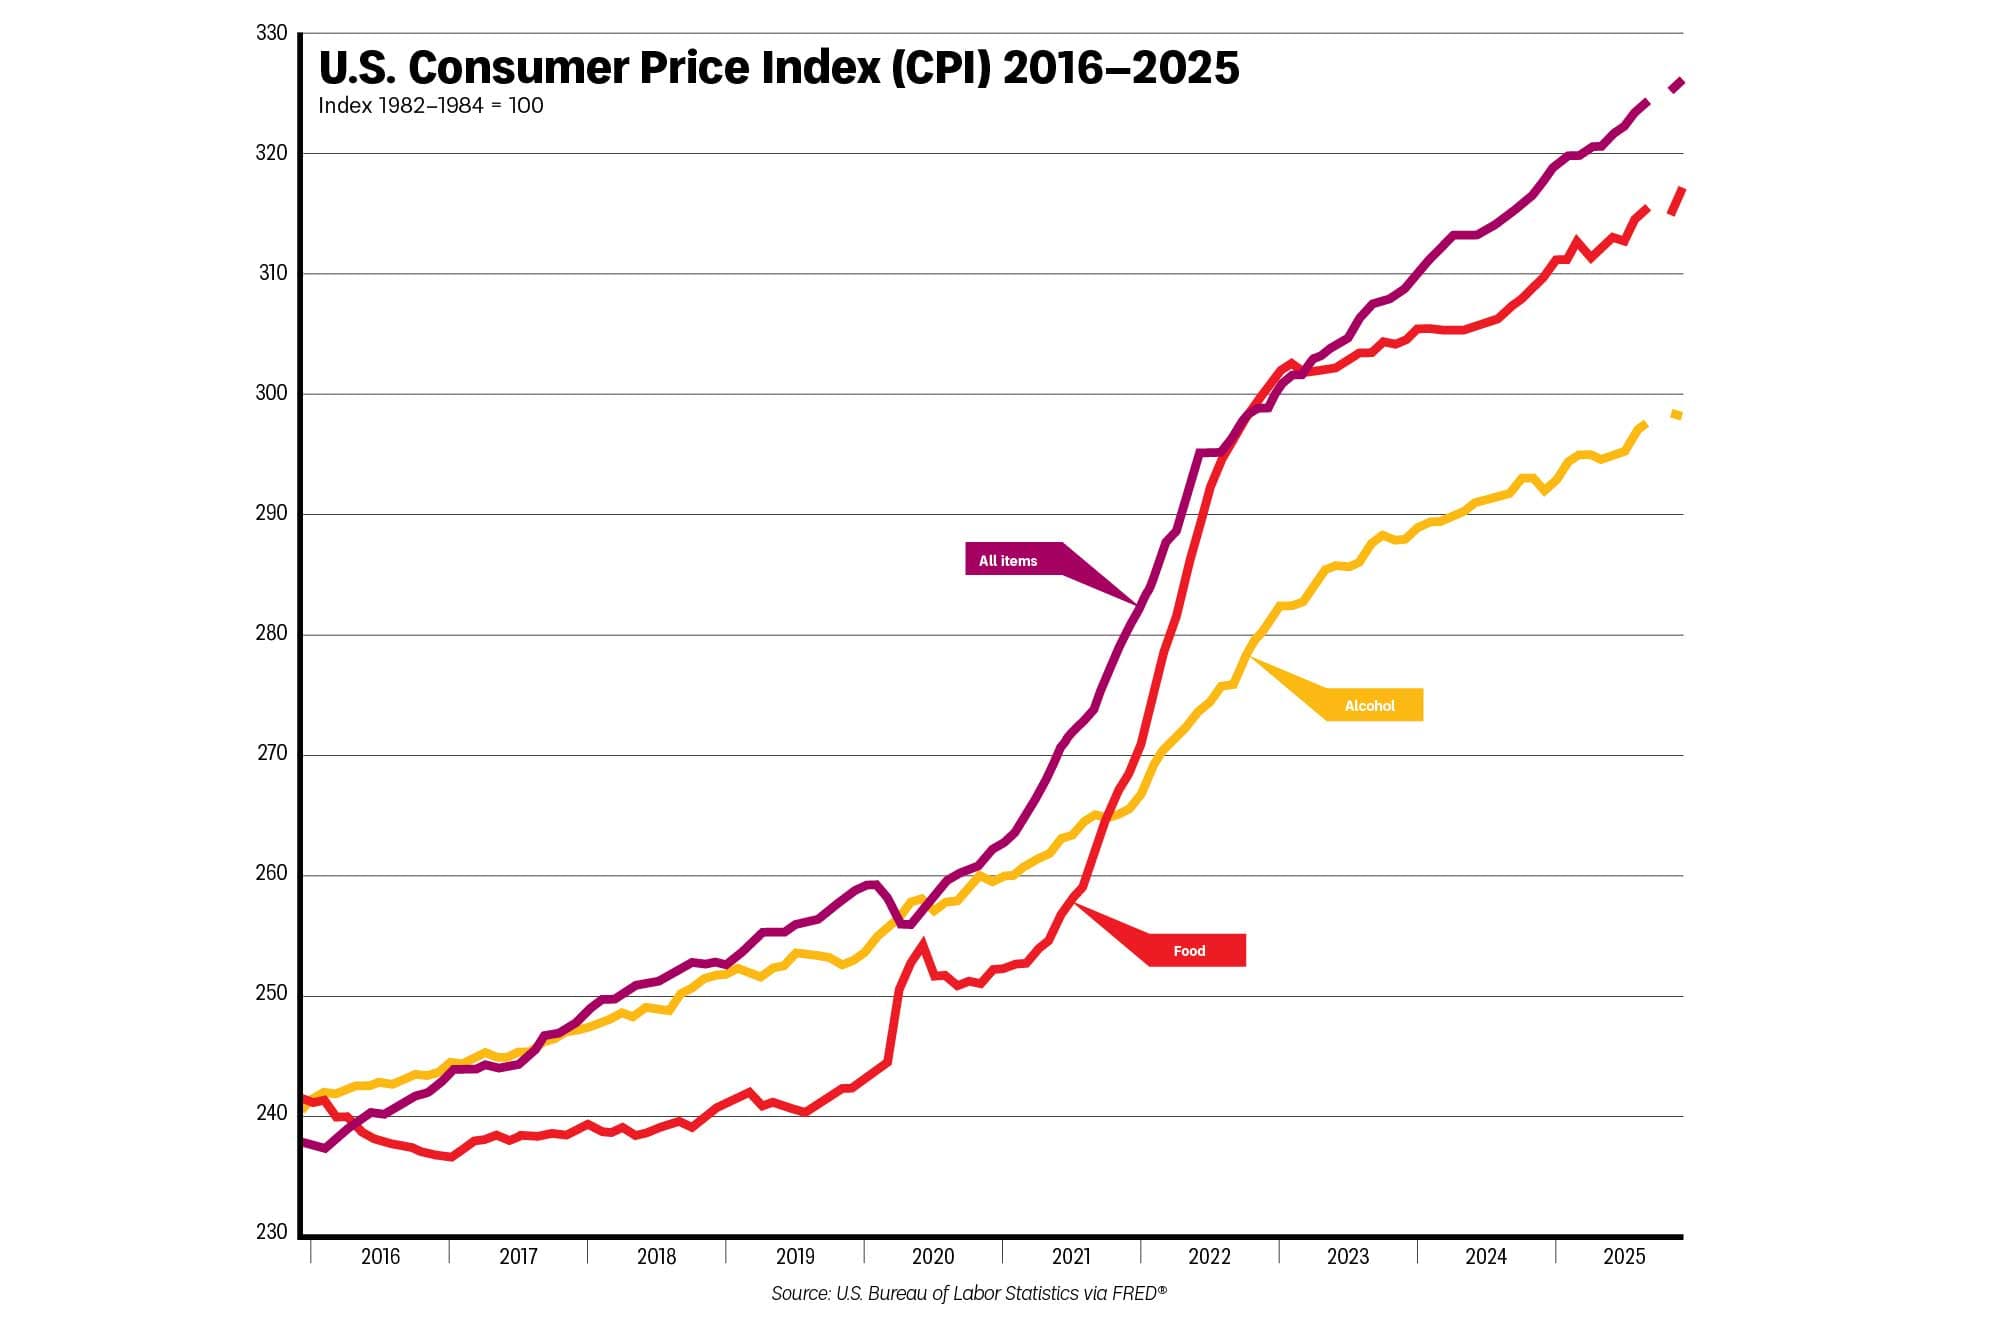
It seems like everything is getting more expensive these days, but what about the price of alcoholic beverages? Let’s take a closer look.
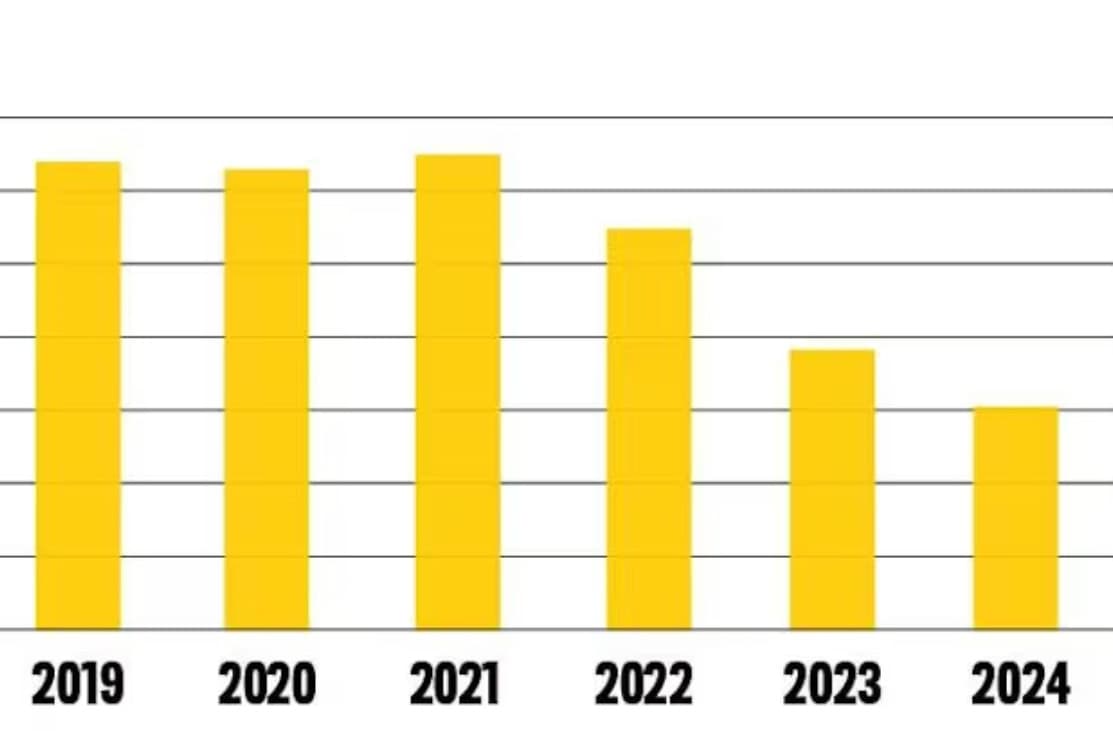
Is it true that younger people are drinking less beer? And are there fewer beer drinkers than there used to be? Let’s consider some numbers that might undermine those assumptions.
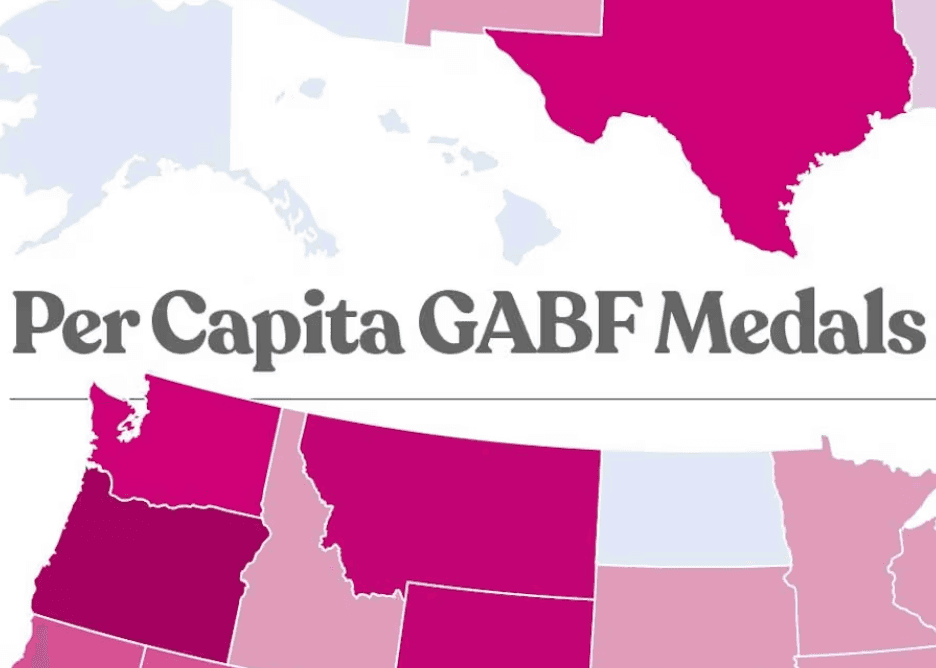
The most prestigious beer competition in the United States is open to breweries from across the country, but some states tend to win more than others for reasons that include population size (i.e., more breweries) and proximity. Let’s take a closer look.
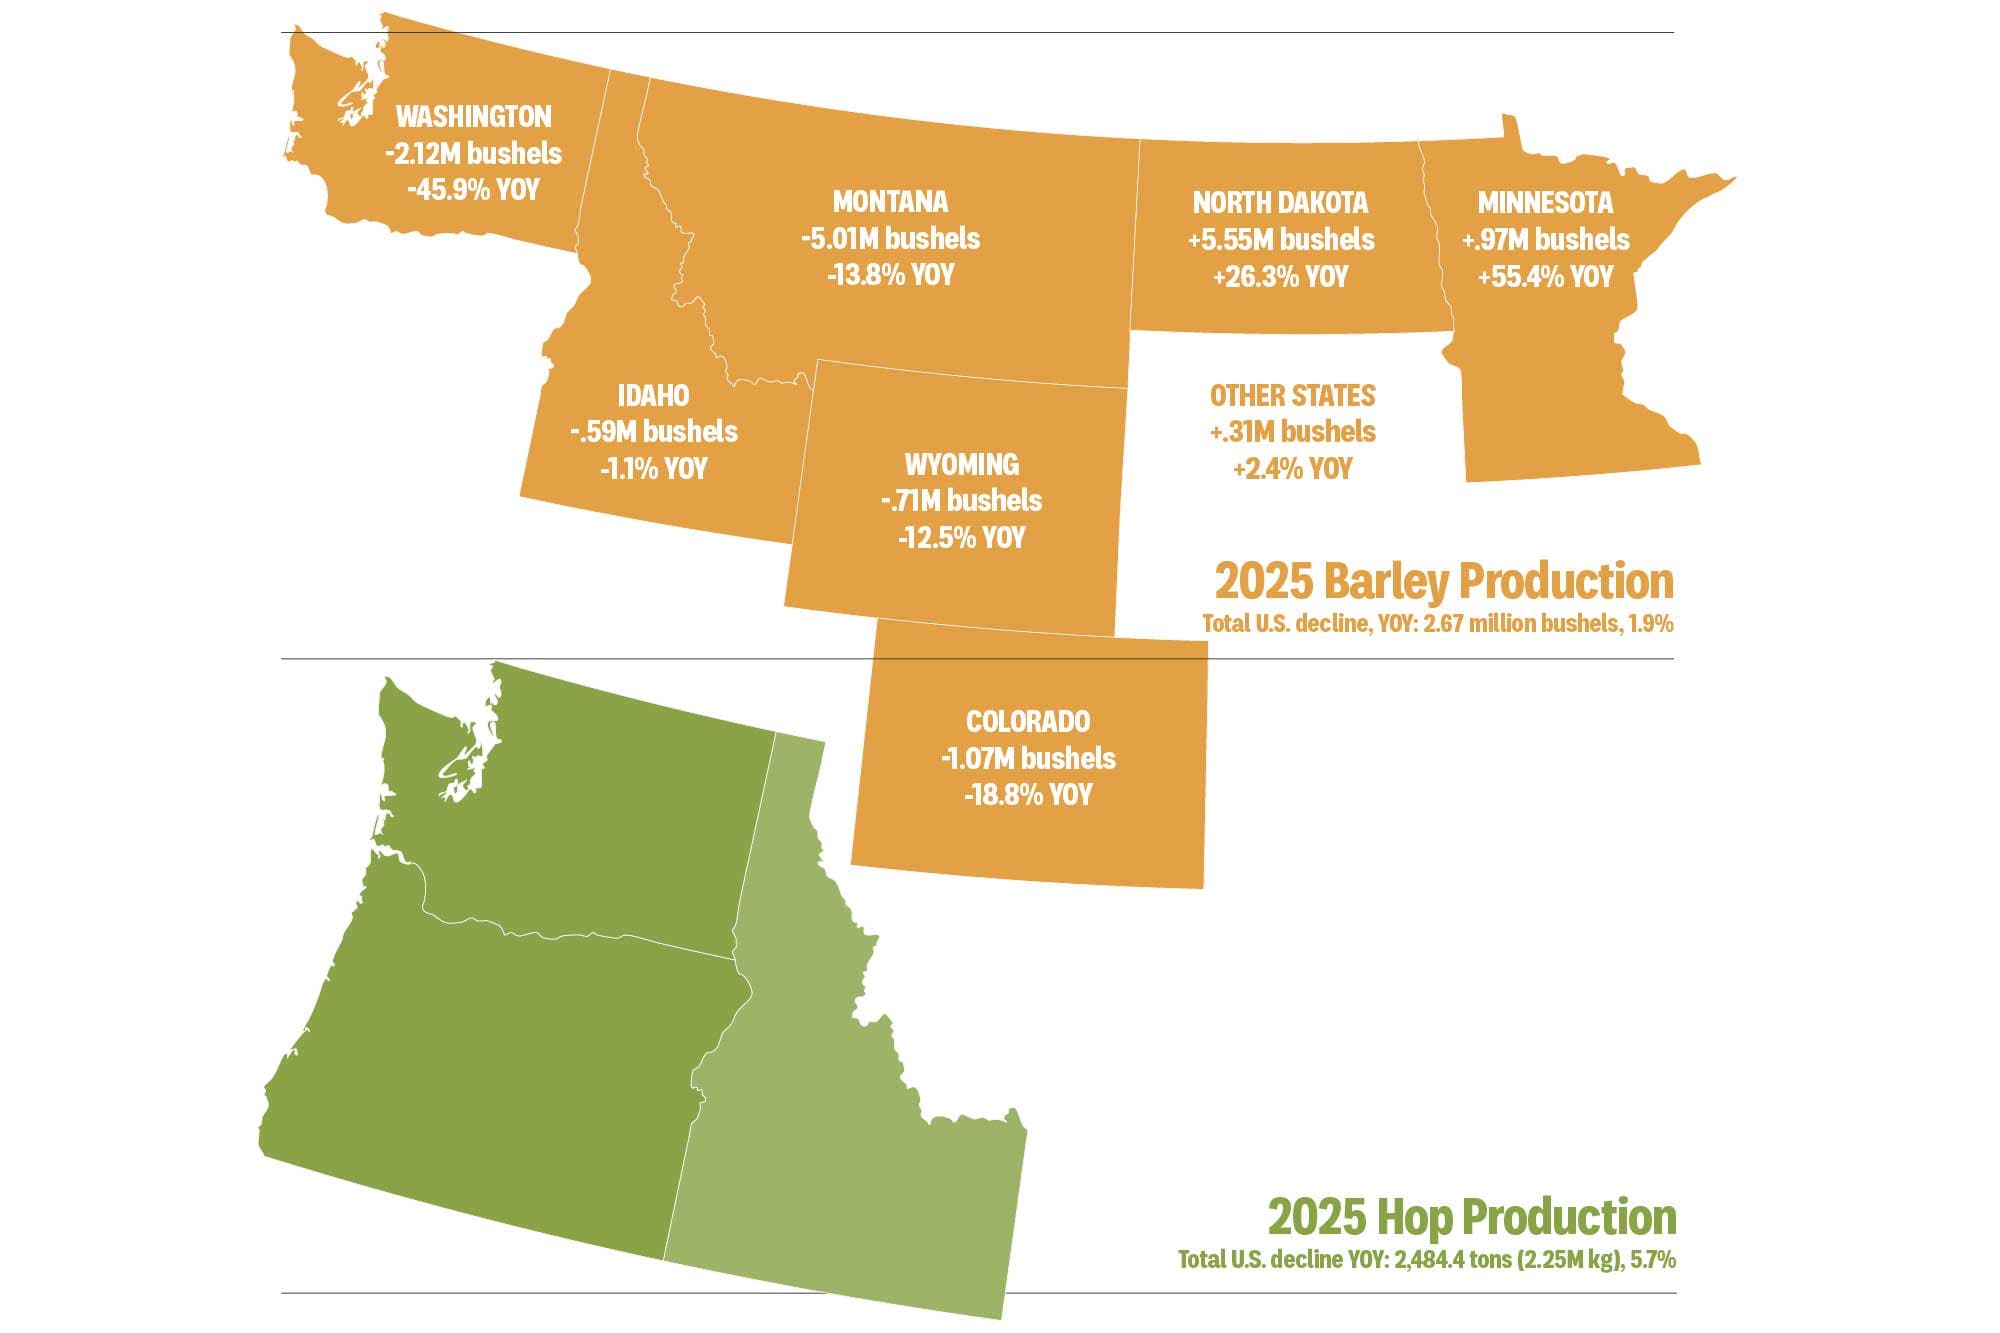
There’s no beer without the farmers who grow its ingredients, and there’s no sugar-coating the impact of beer’s current pullback on what they need from those farms. Here we map the year-over-year changes in barley and hop production based on data from the USDA.
Based on some of the latest economic data, here are a few visuals on the recent growth in nonalcoholic beer.
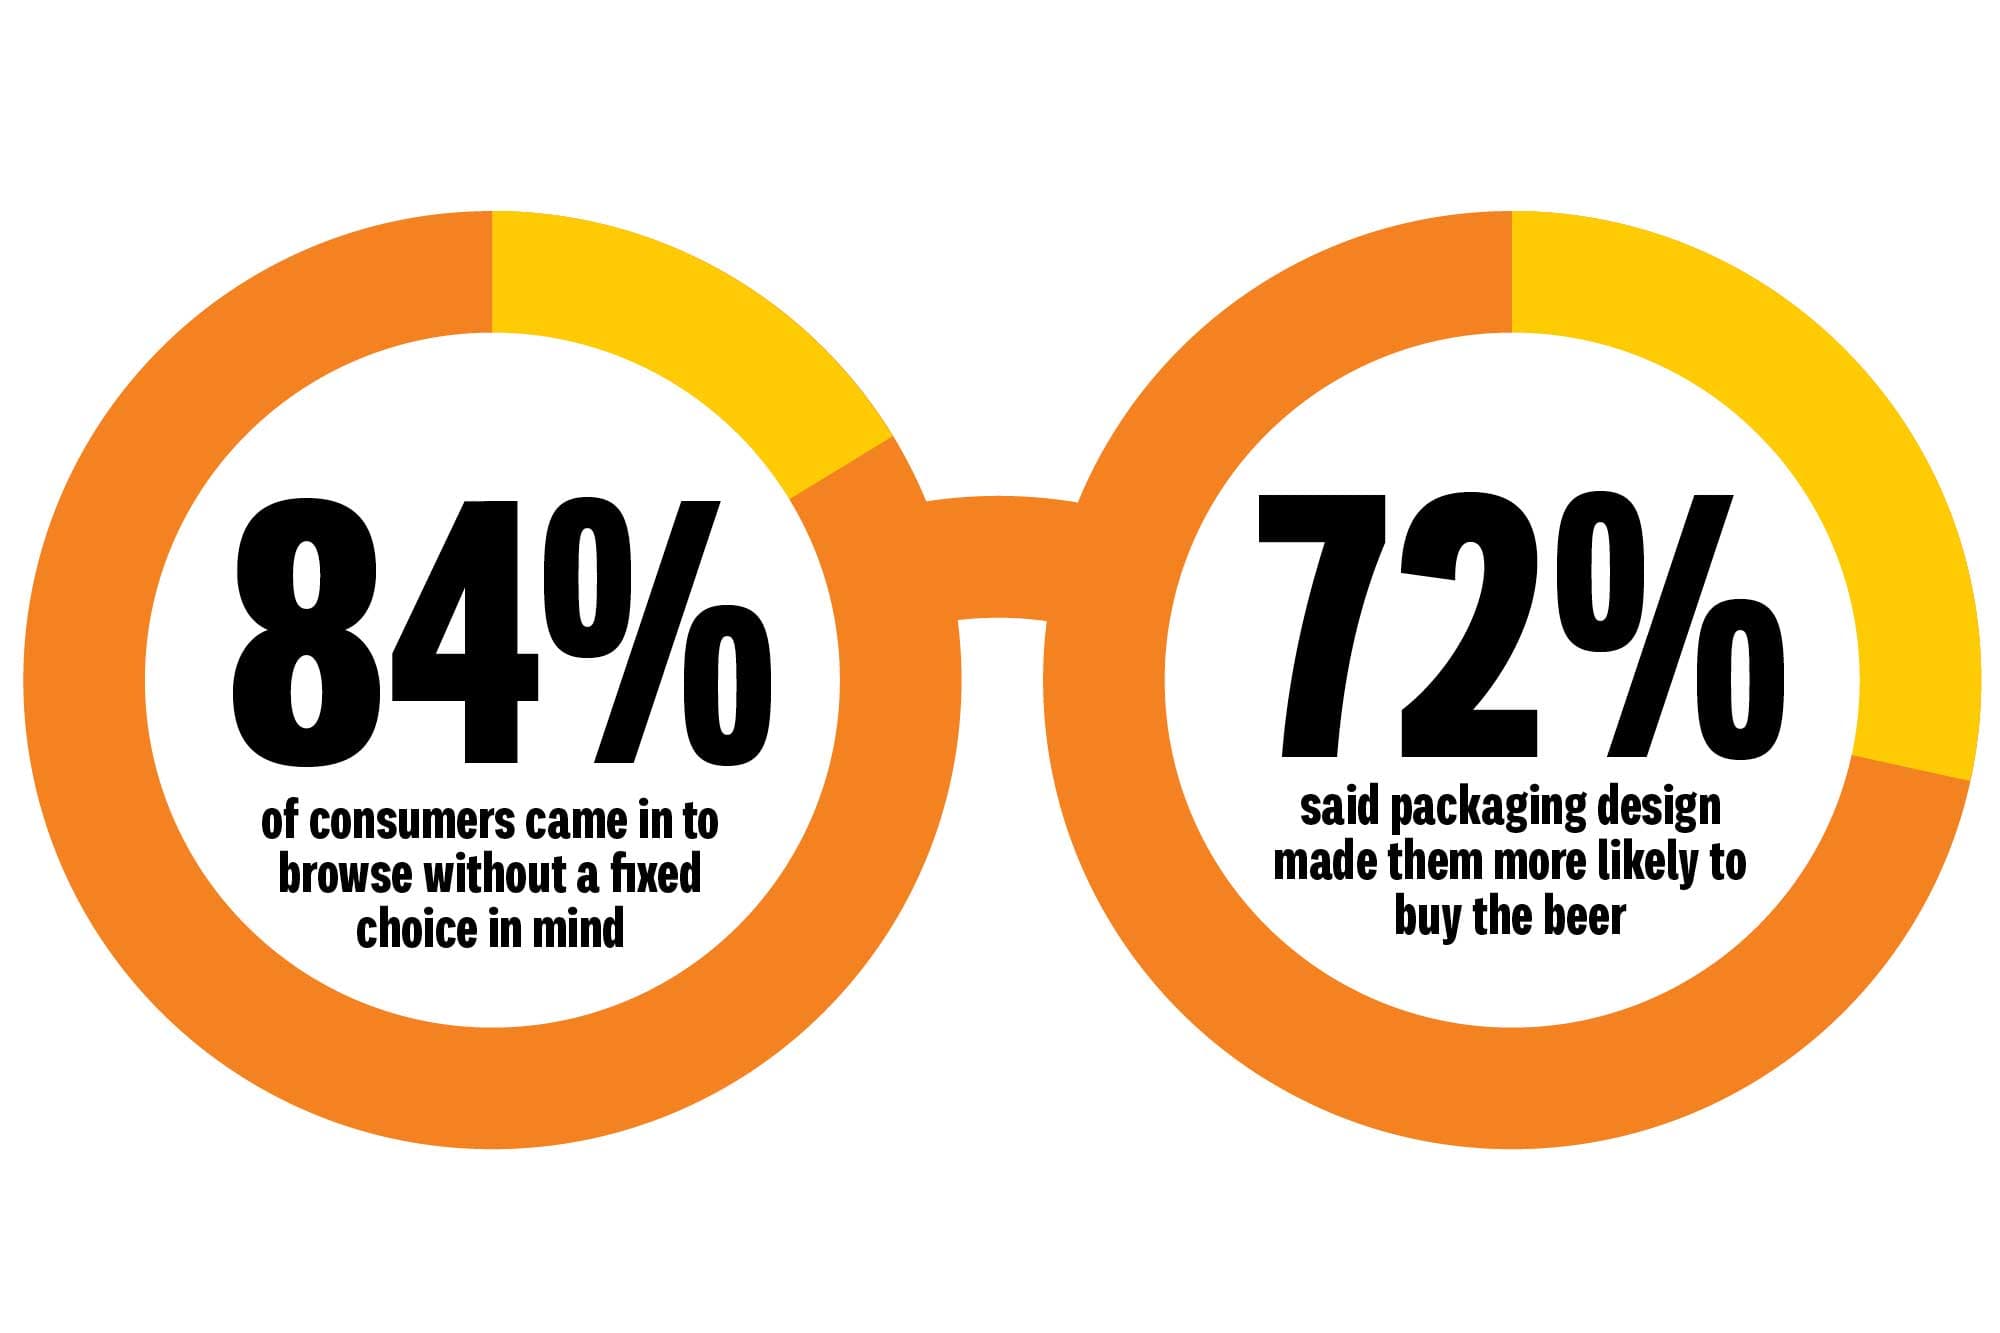
Store shelves are crowded, and great packaging can help brands connect with customers amid the competition. Here we look at some findings from a study that tracked customers’ eye movements when shopping for beer.
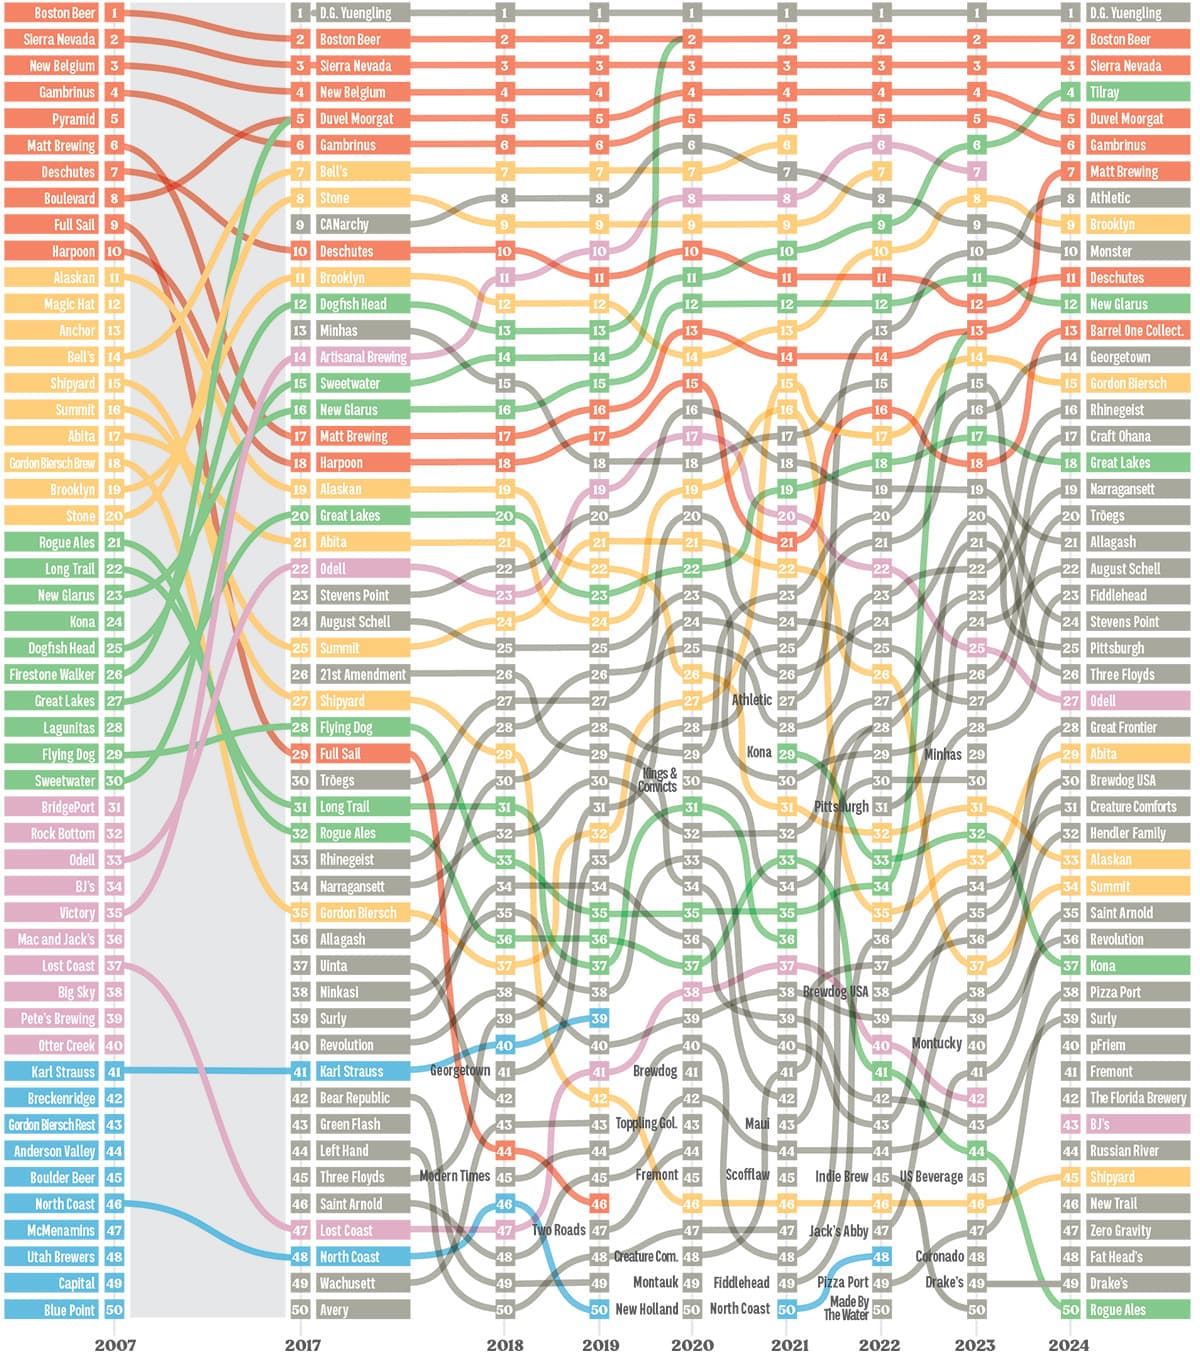
In this yearly update, we plot the moves in the Brewers Association’s top 50 craft brewers by production volume, from 2007 to the present.
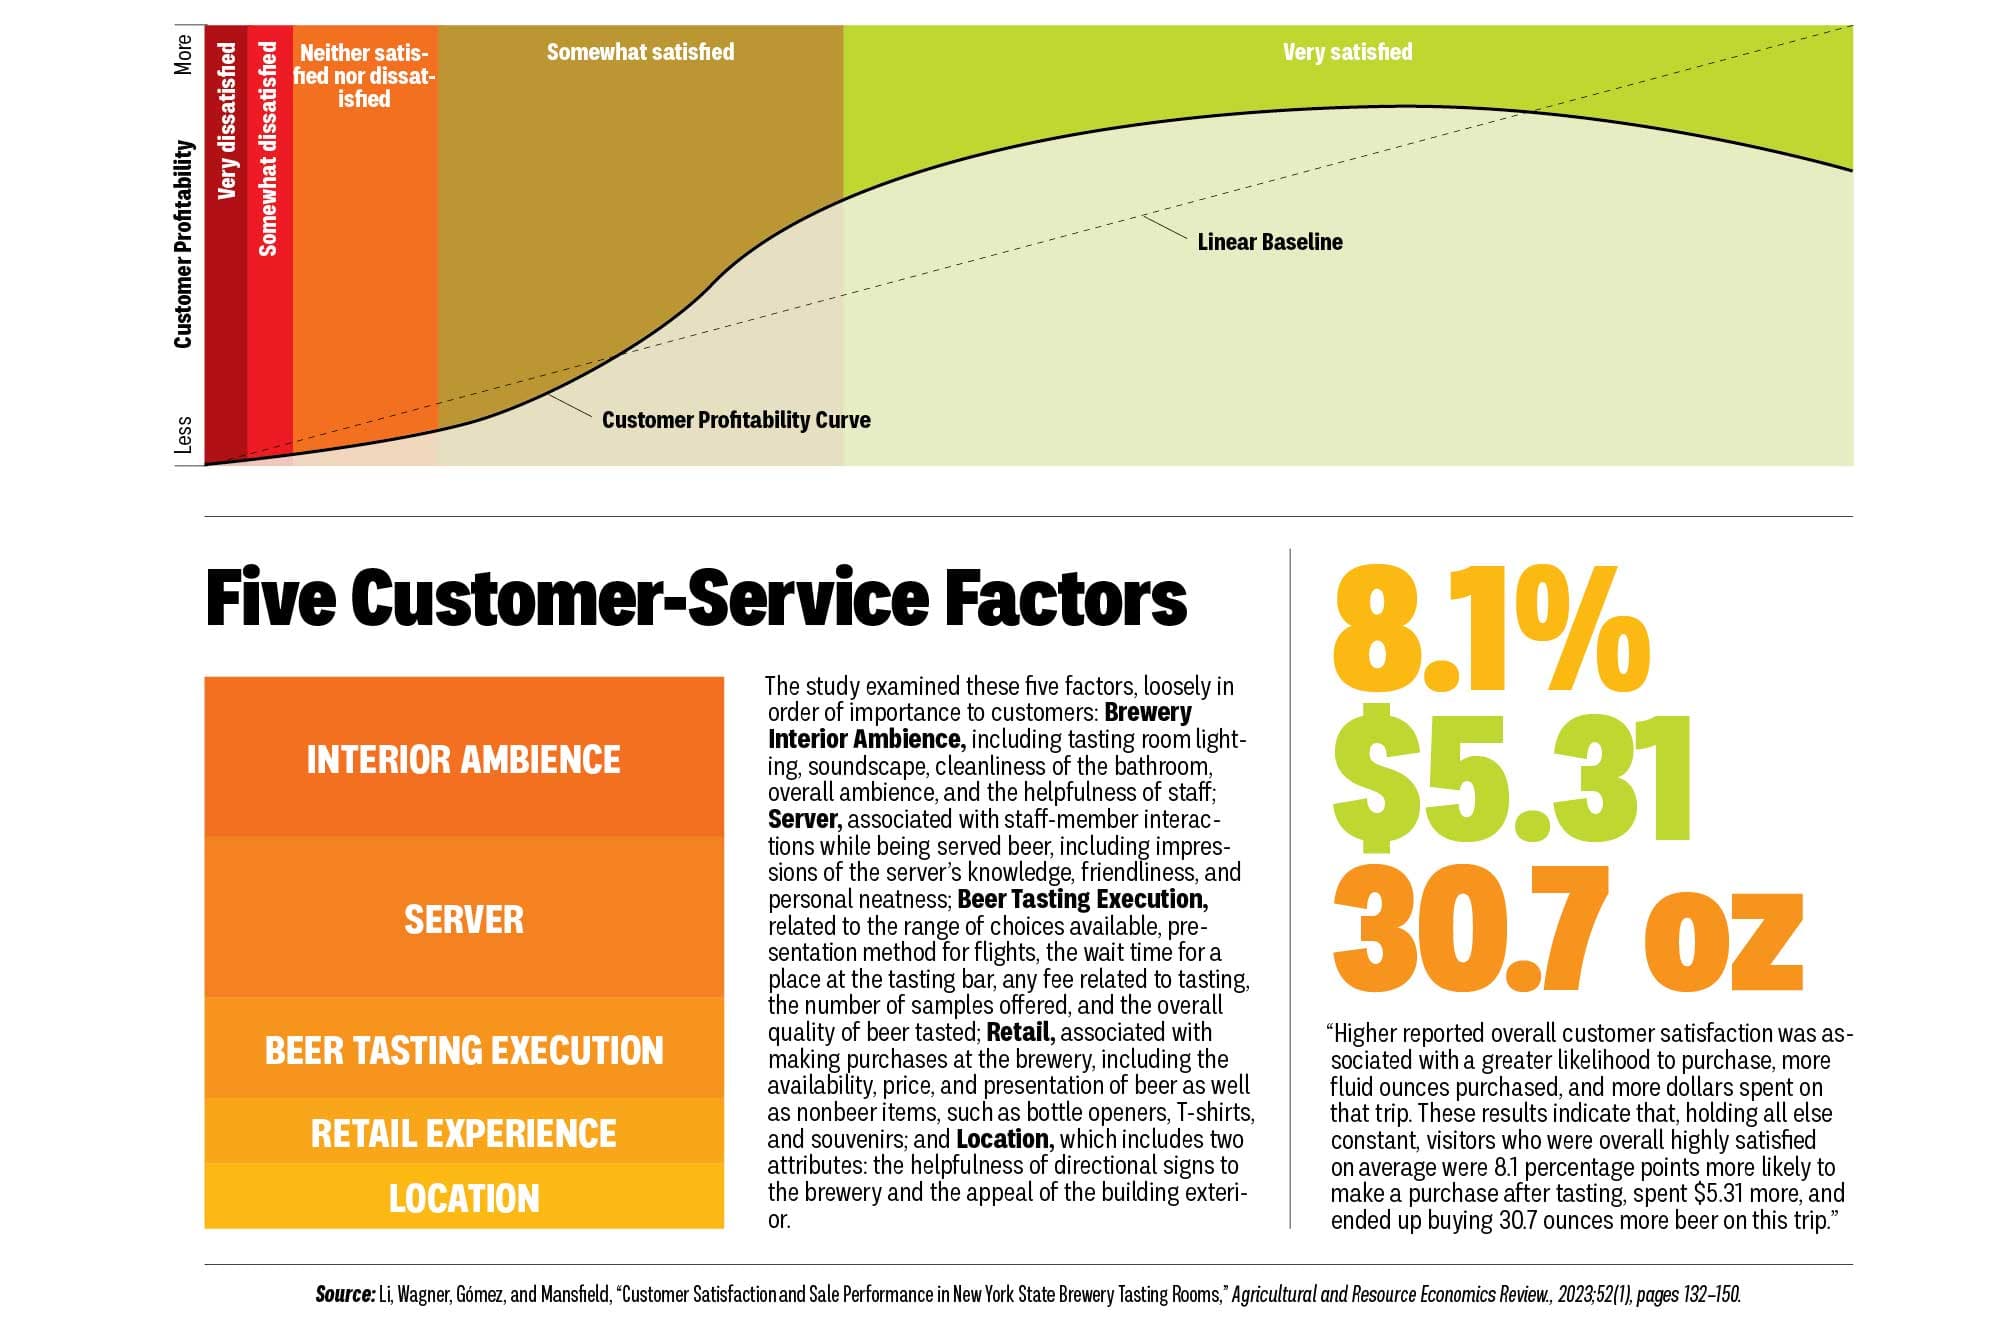
Based on some recent research, here’s a visual look at the connection between consumer satisfaction and profit at smaller breweries.
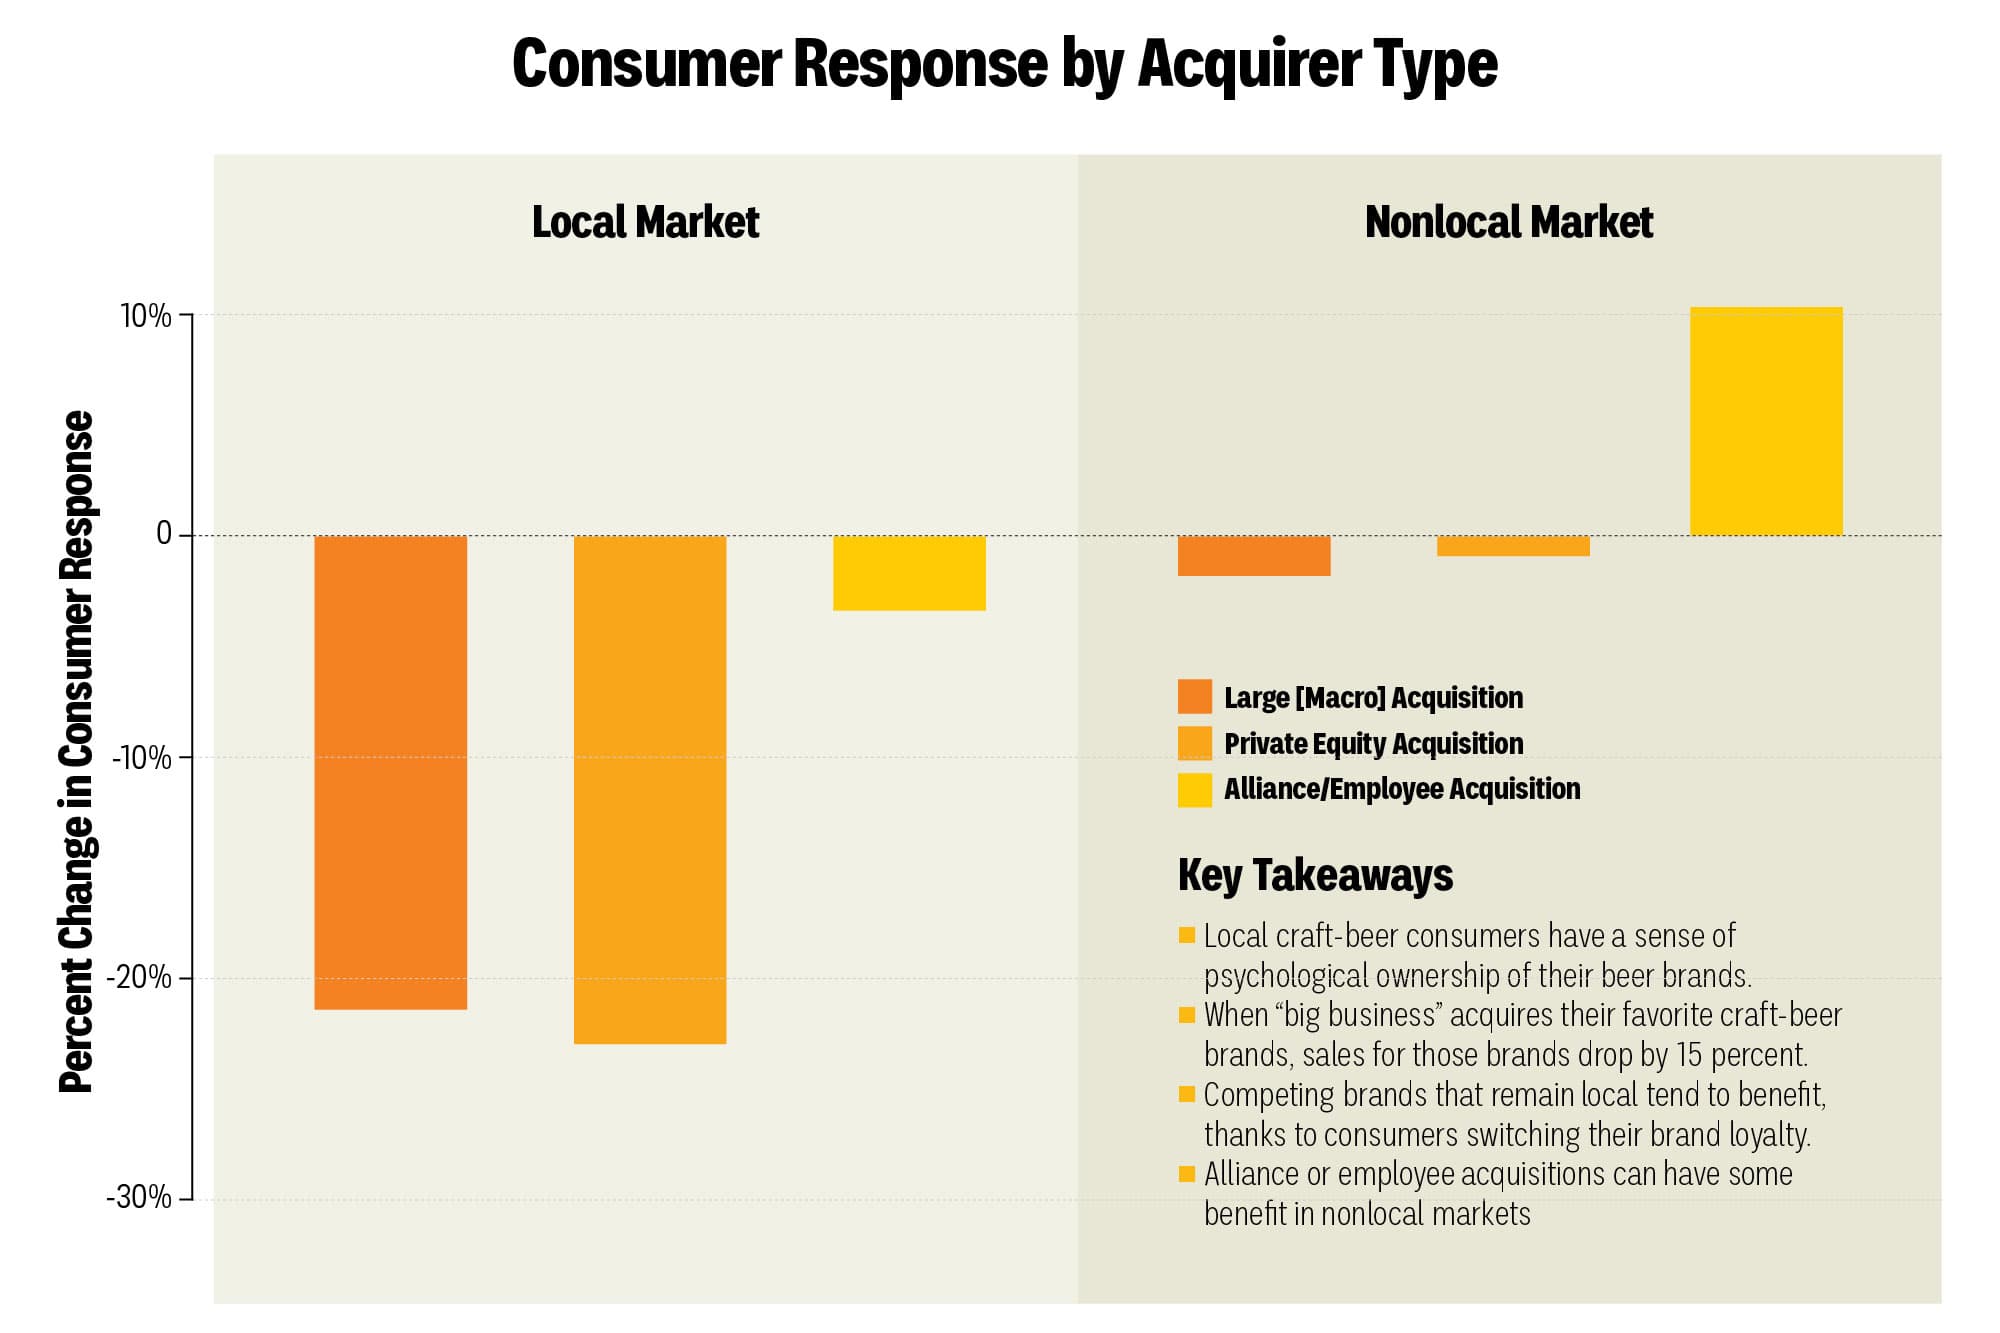
Anecdotally, we’ve all seen just how much weight consumers put on the idea of “local” when choosing beers and breweries. But how much value do they really place on this often-ambiguous concept?
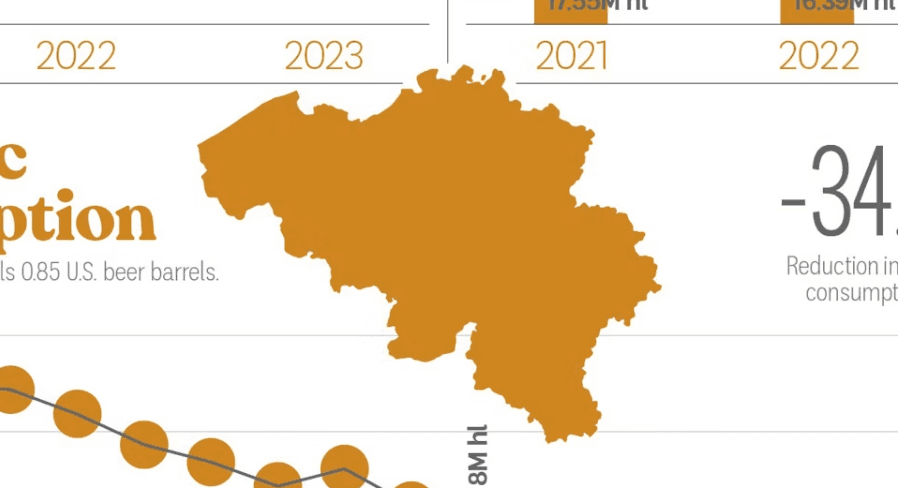
What do changes in the beer market and drinking habits portend for one of the most creative and influential beer-producing countries? These data points from the Belgian Brewers industry group provide an eye-opening glimpse.
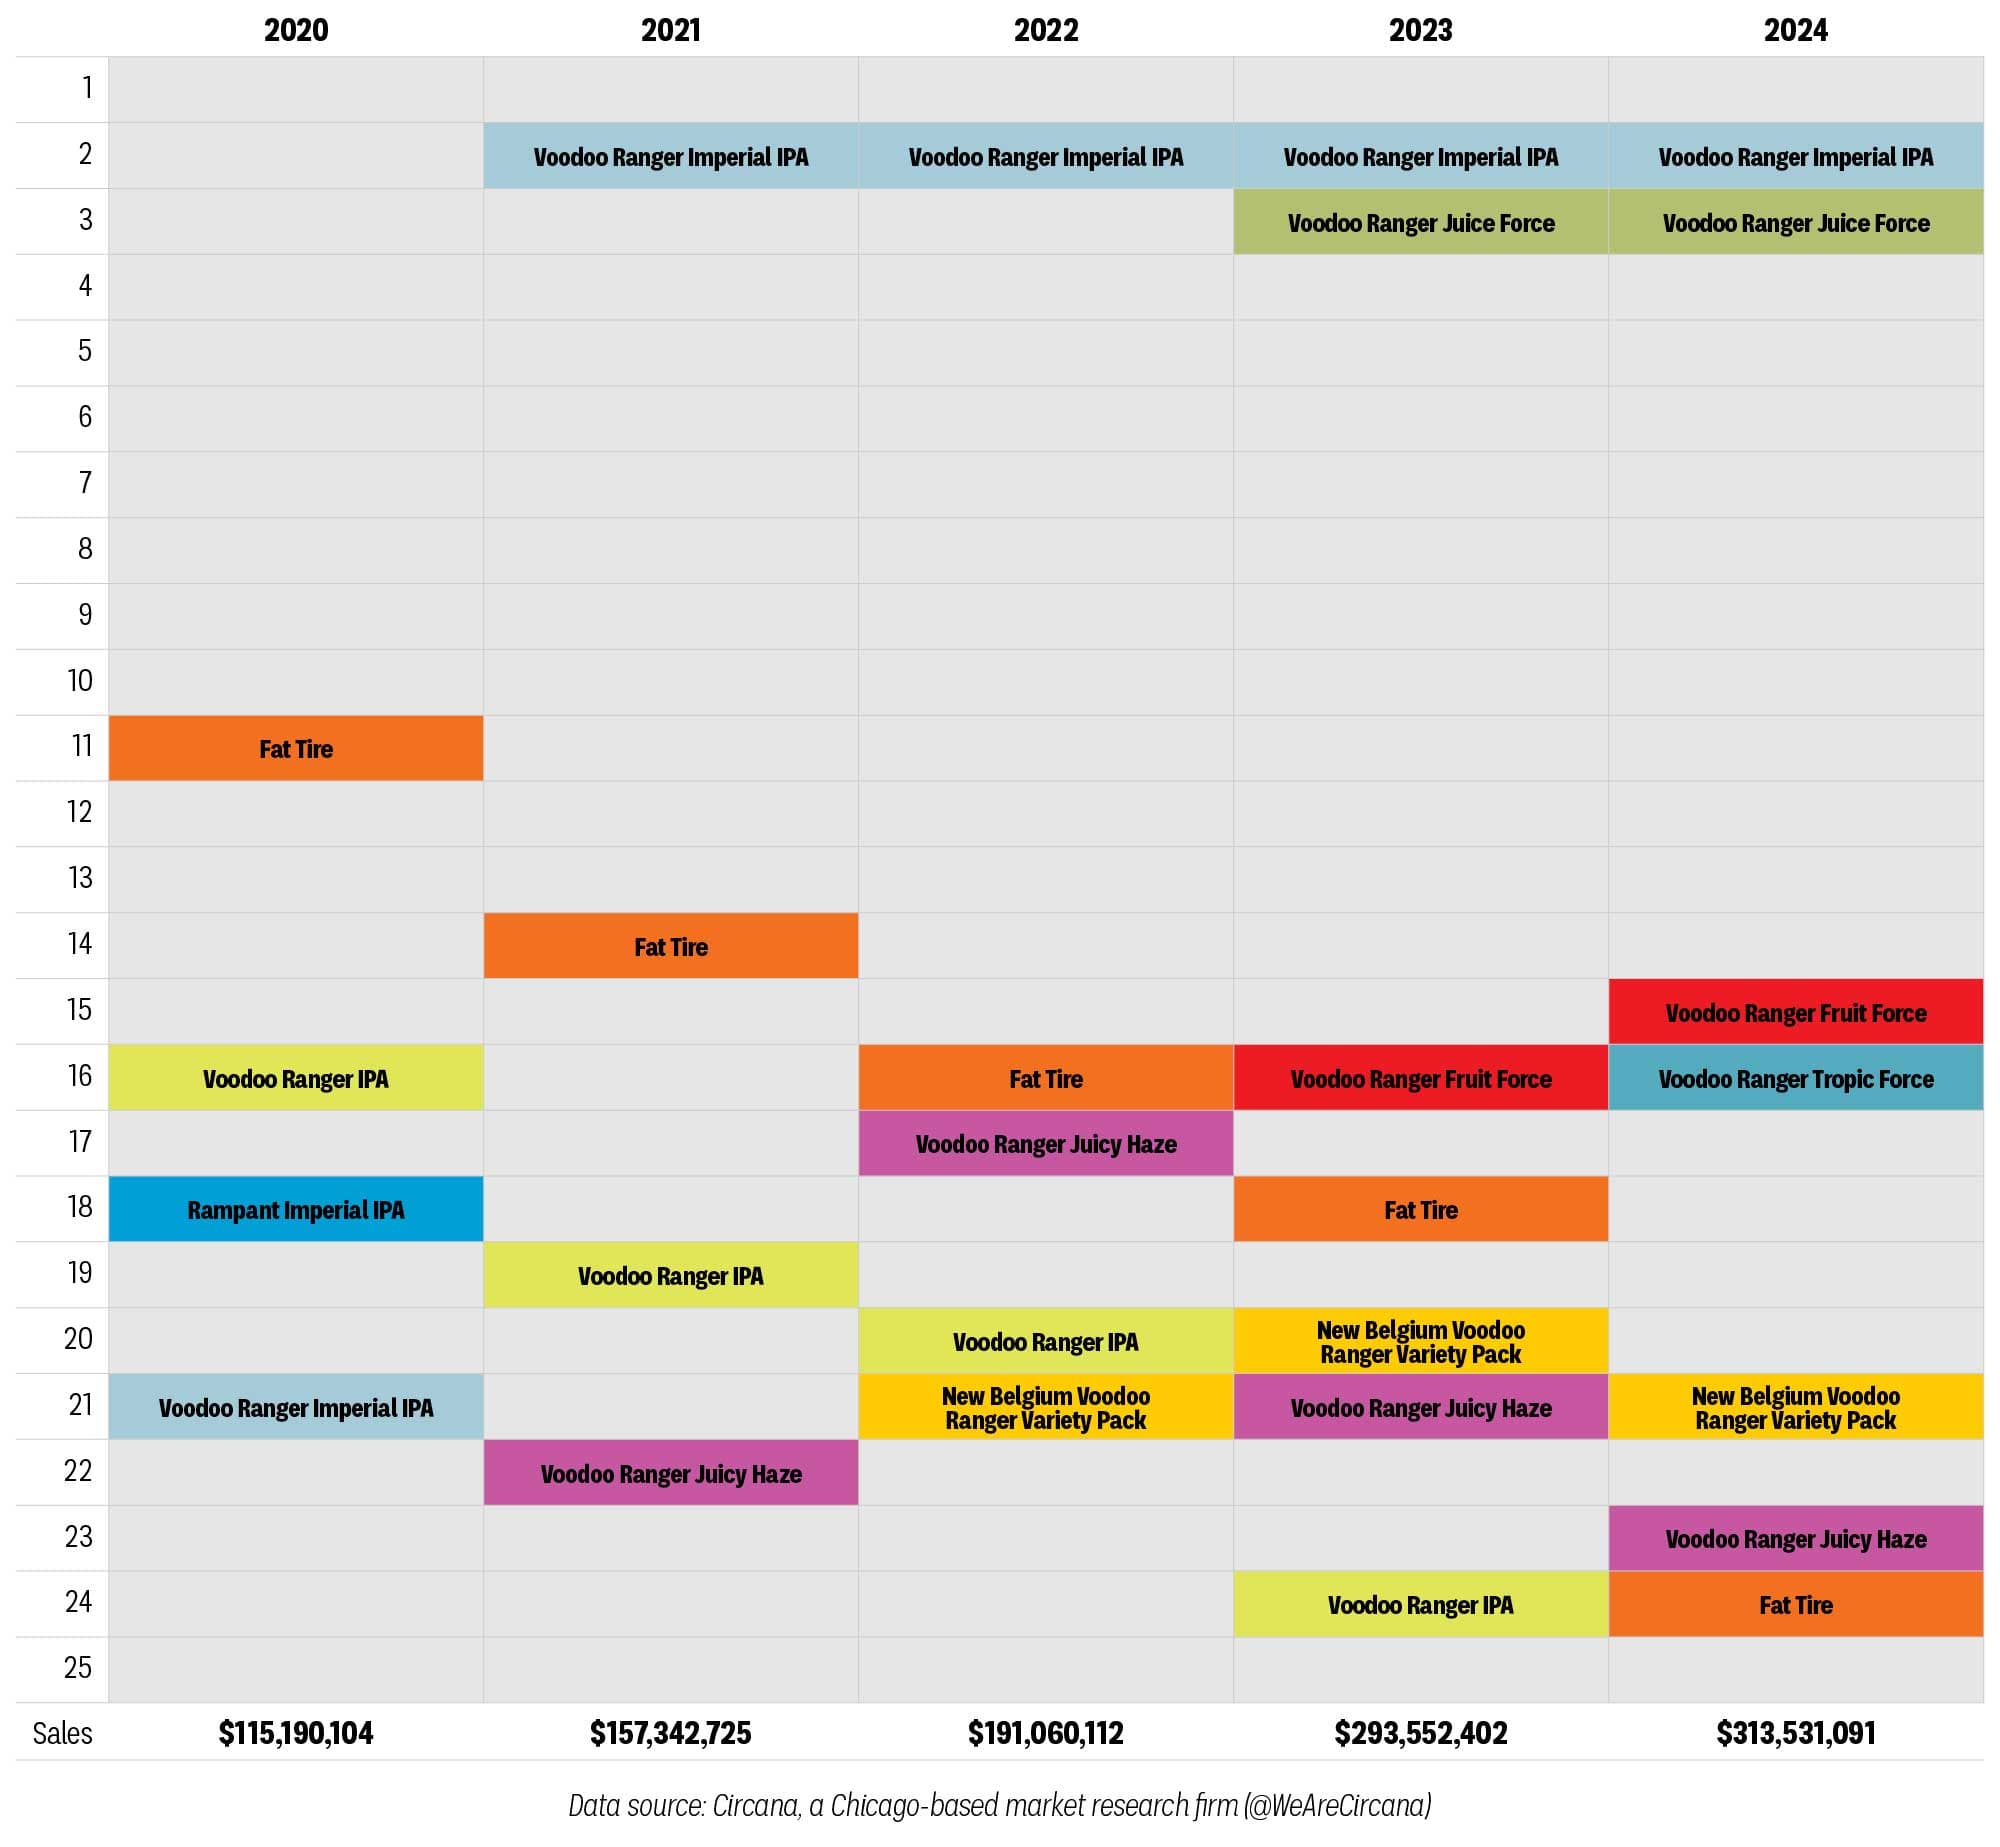
Not every brand can be a hit. Even at the most successful breweries, classics must make way for new chart-toppers. Here, we chart New Belgium’s brands as they’ve appeared among the top 25 craft beers annually since 2020, as the Voodoo Ranger line has ascended.
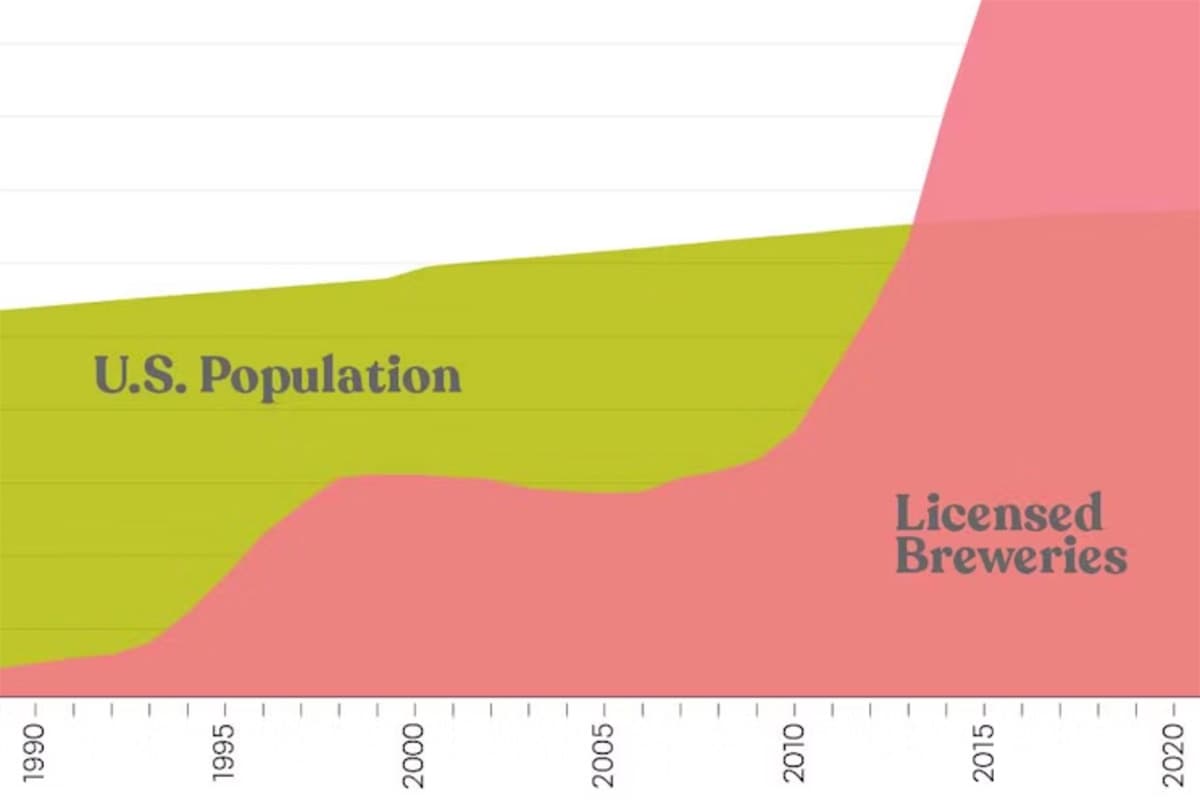
Here's a fresh look at the growth in the number of breweries in the United States—growth that’s been leveling off, recently—with some other data points for context.
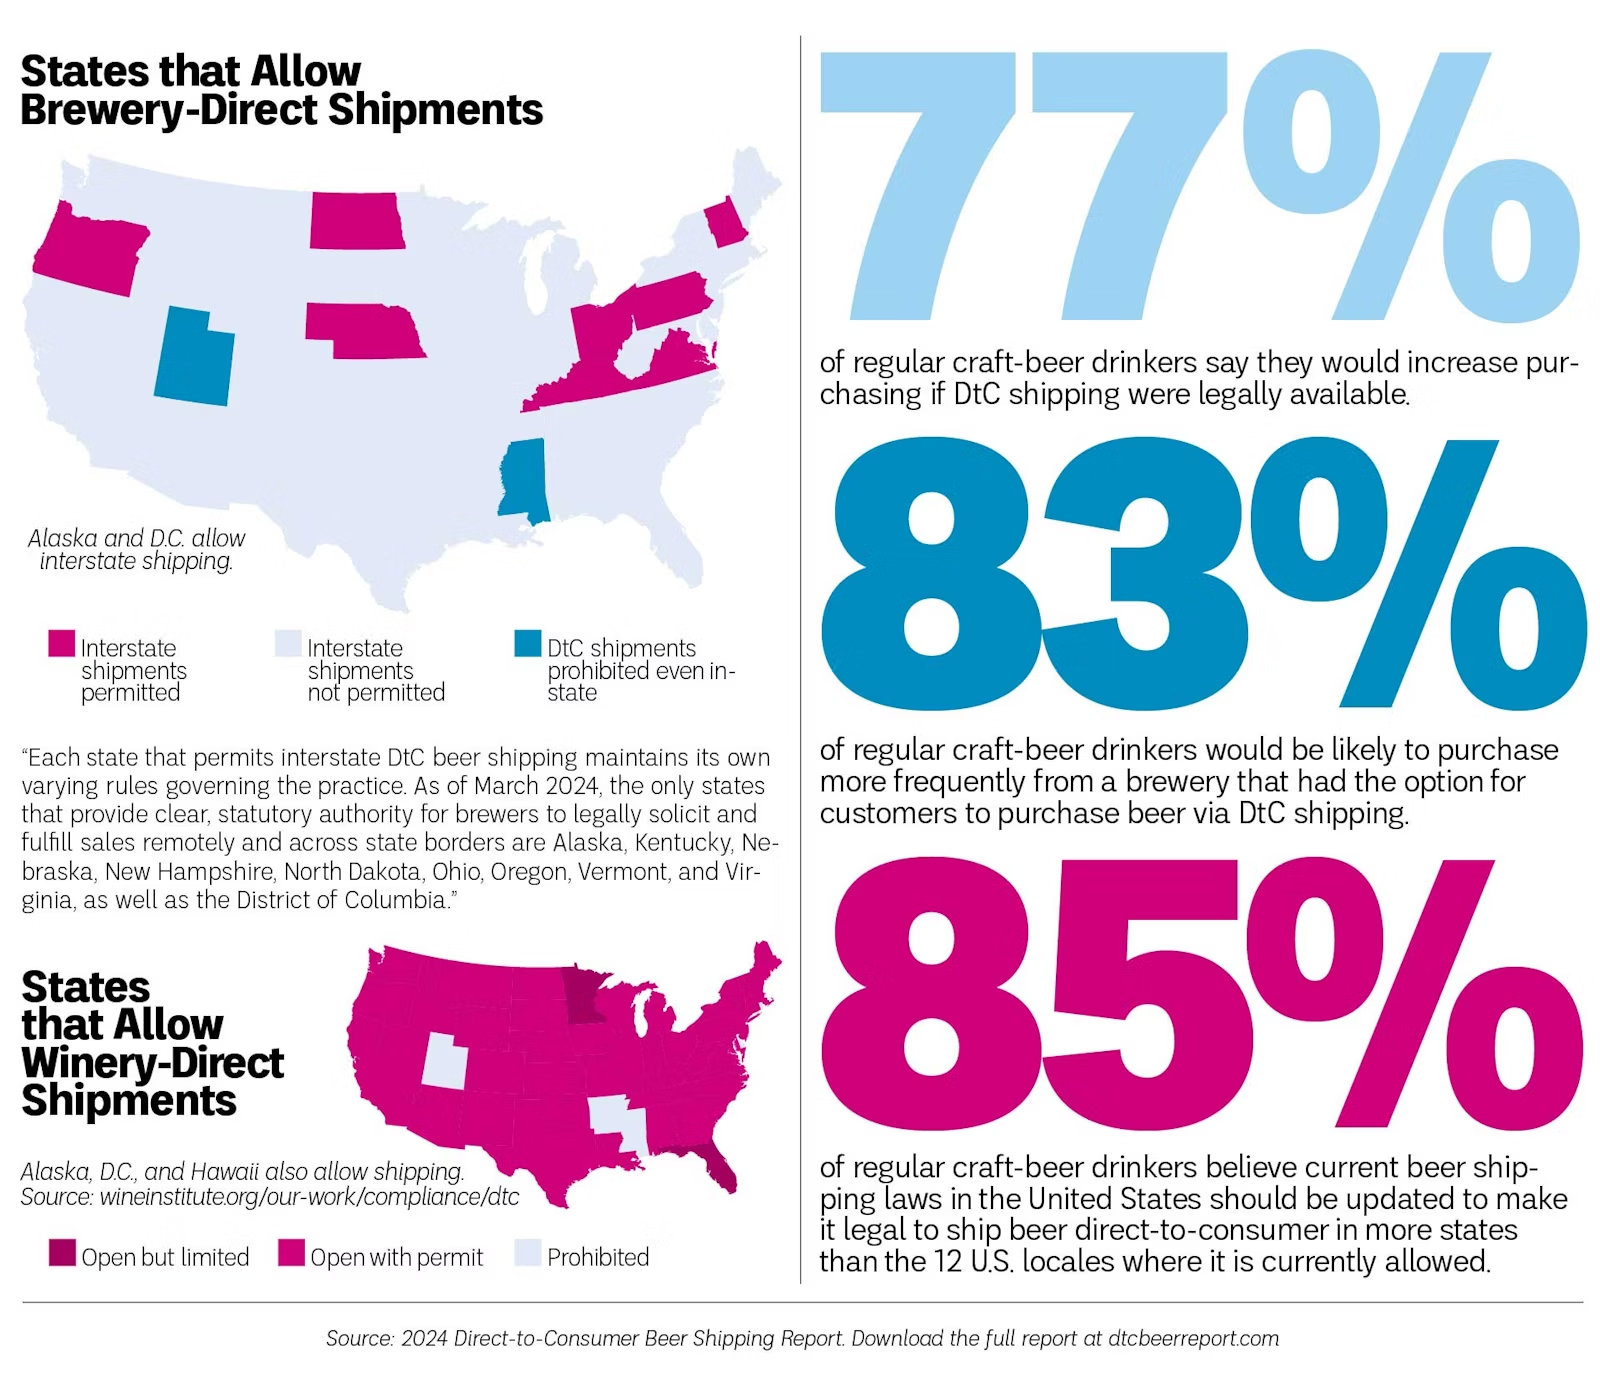
The double standard around shipping alcohol across state lines continues unabated in 2024, as breweries have yet to find parity with wineries in regard to state laws that limit interstate shipments.
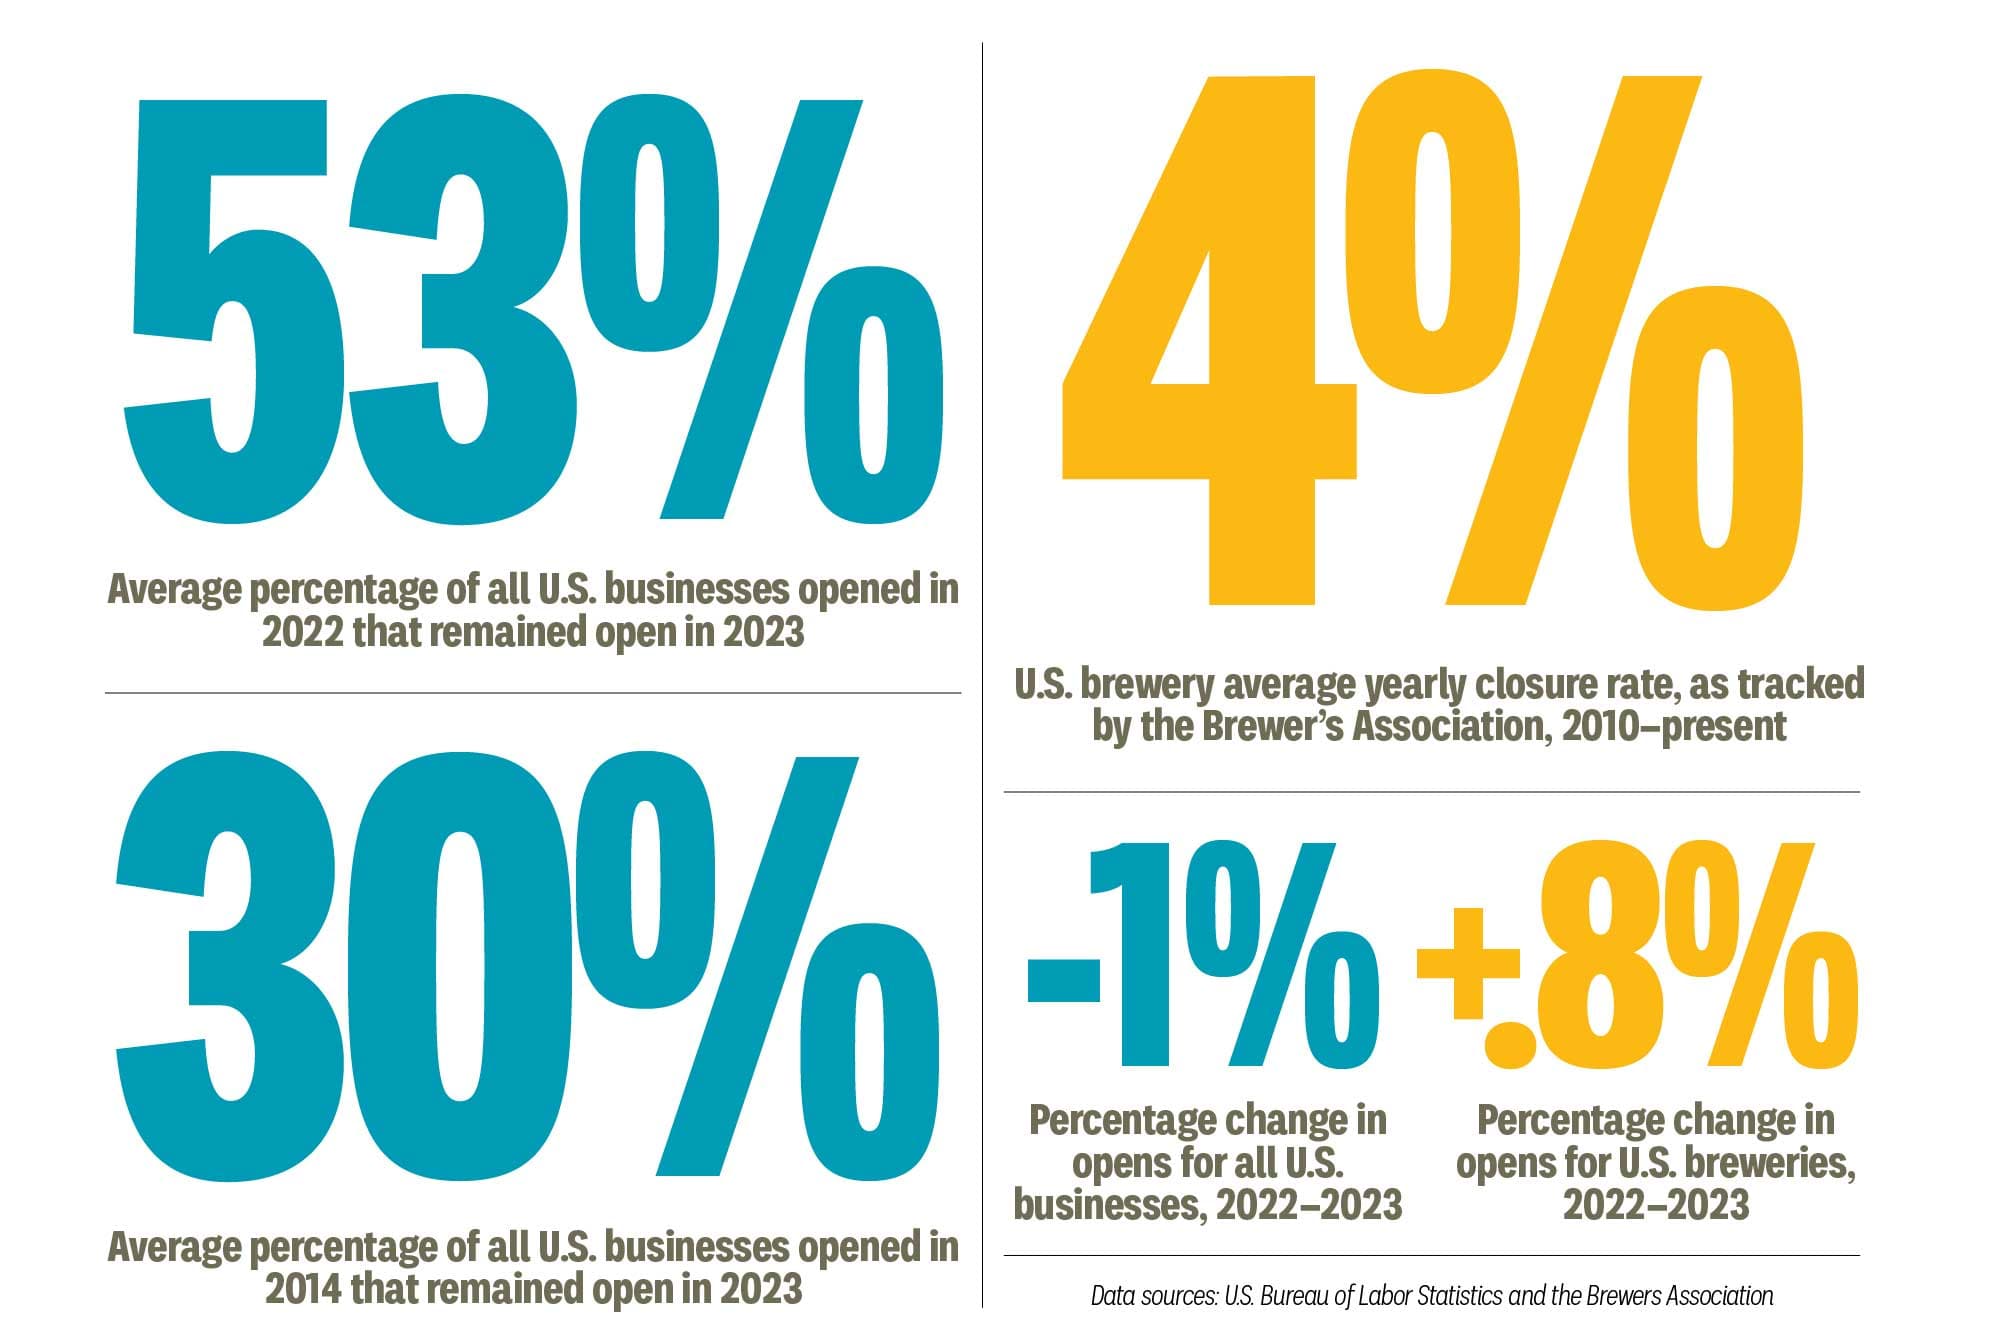
Much is made of the current market challenges facing beer. Lost in the discussion of brewery closures is a broader question: ”What should be normal?” From the Summer 2024 issue of our Brewing Industry Guide, here are a few stats for context.
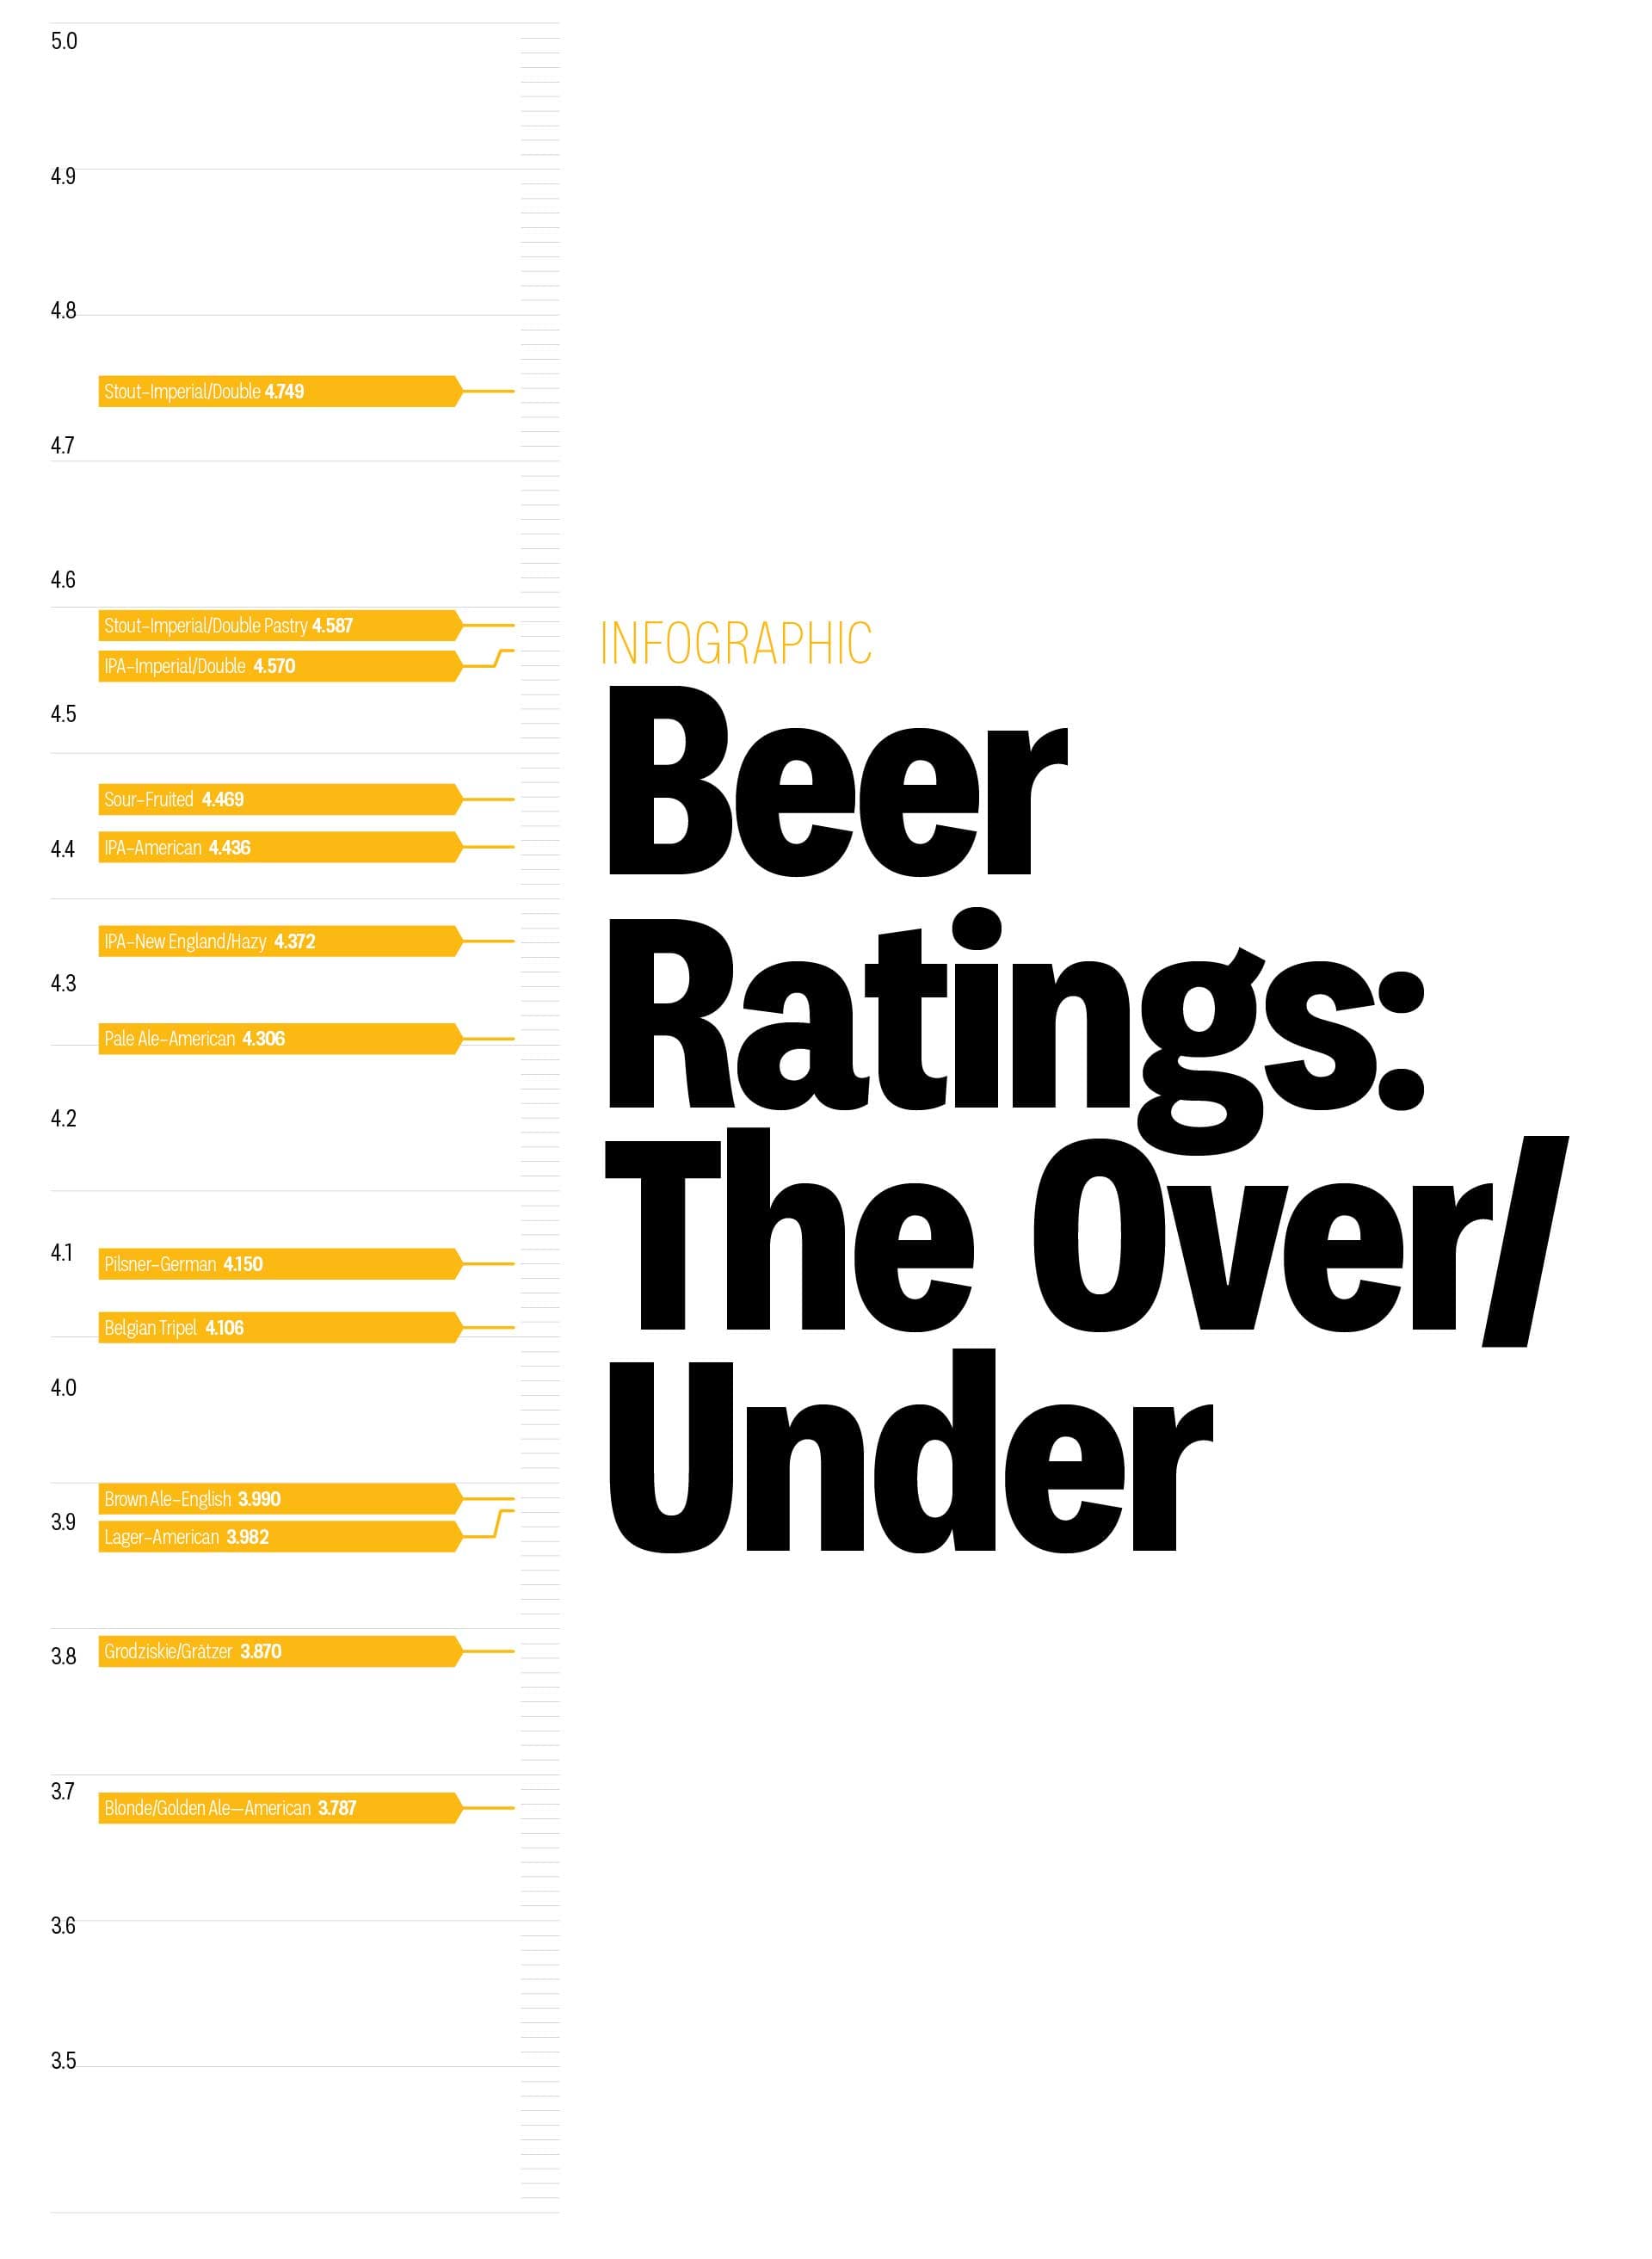
To illustrate how some styles of beer tend to attract more effusive ratings than others, we compared the top scorers in several categories.
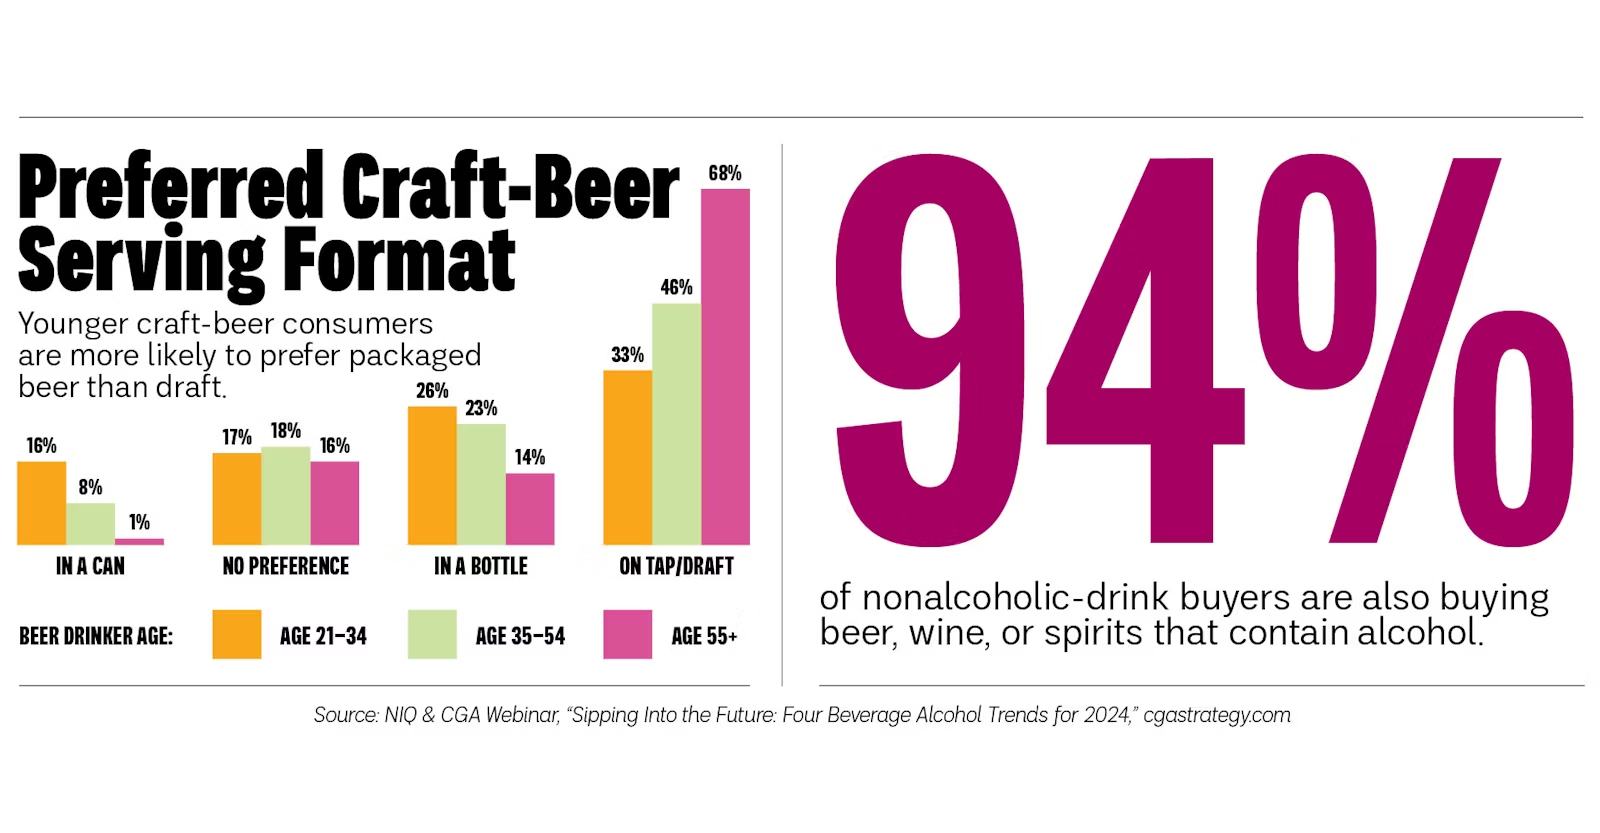
Beer-drinking habits continue to evolve in unexpected ways, whether it’s adding nonalcoholic drinks to a beer purchase, younger drinkers being more likely to prefer packaged beer over draft—are bottles getting cool again?—or beer consumption itself defying common assumptions, such as the modest increase among our (admittedly self-selected) audience. Here, we plot a few interesting points.
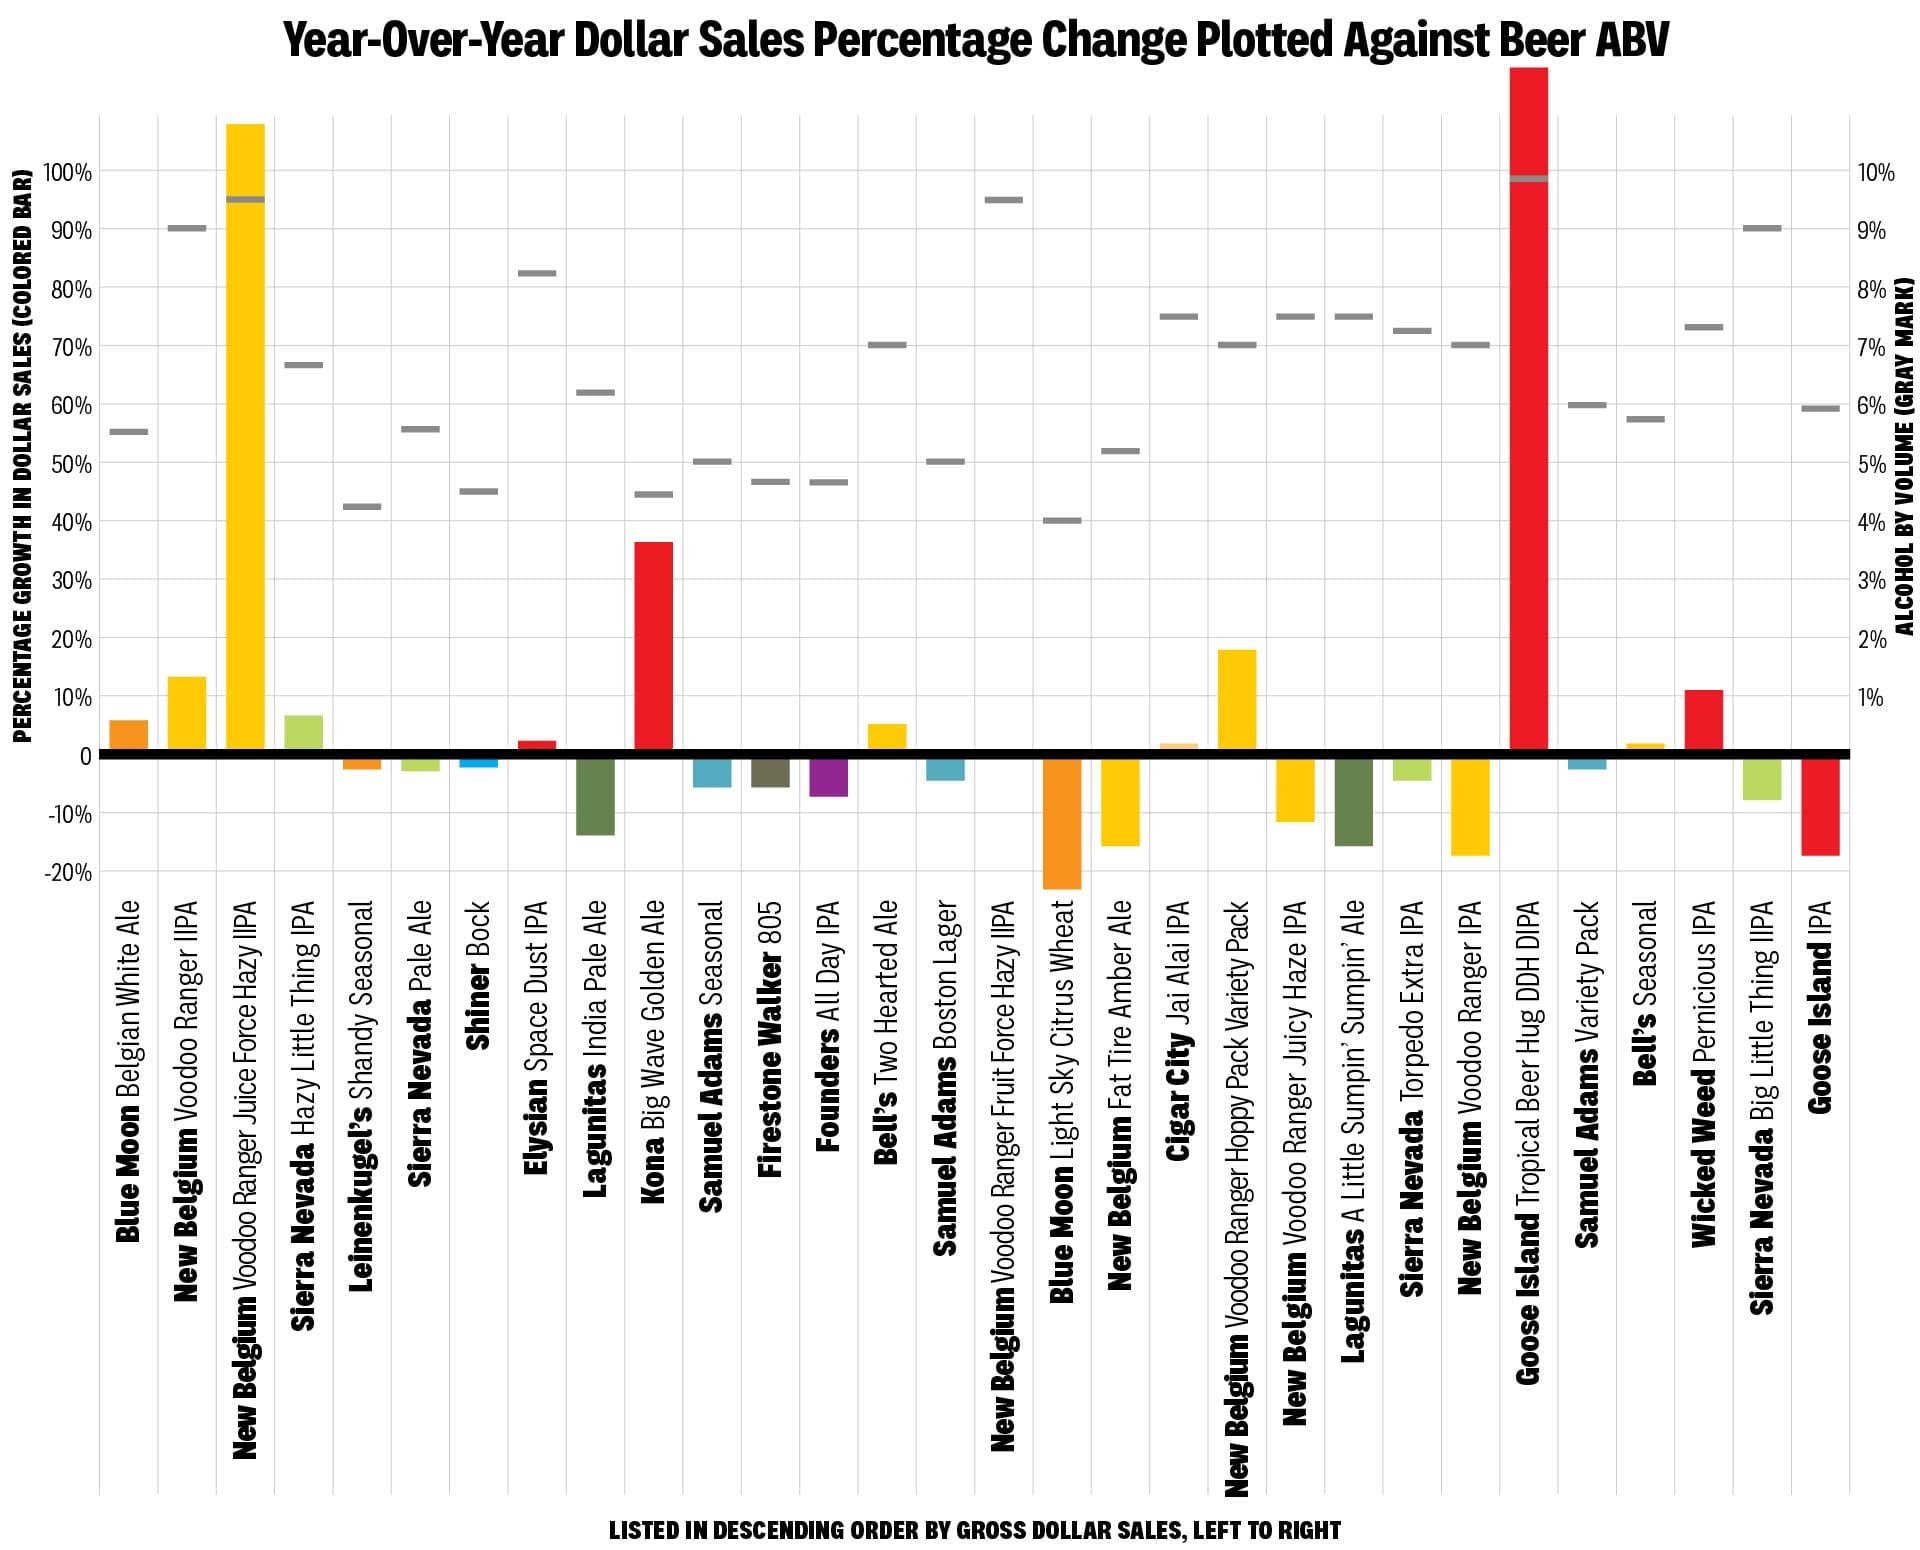
This year has seen craft beer continue its remarkable bifurcation in purchasing behavior, as on-premise diverges ever further from retail.
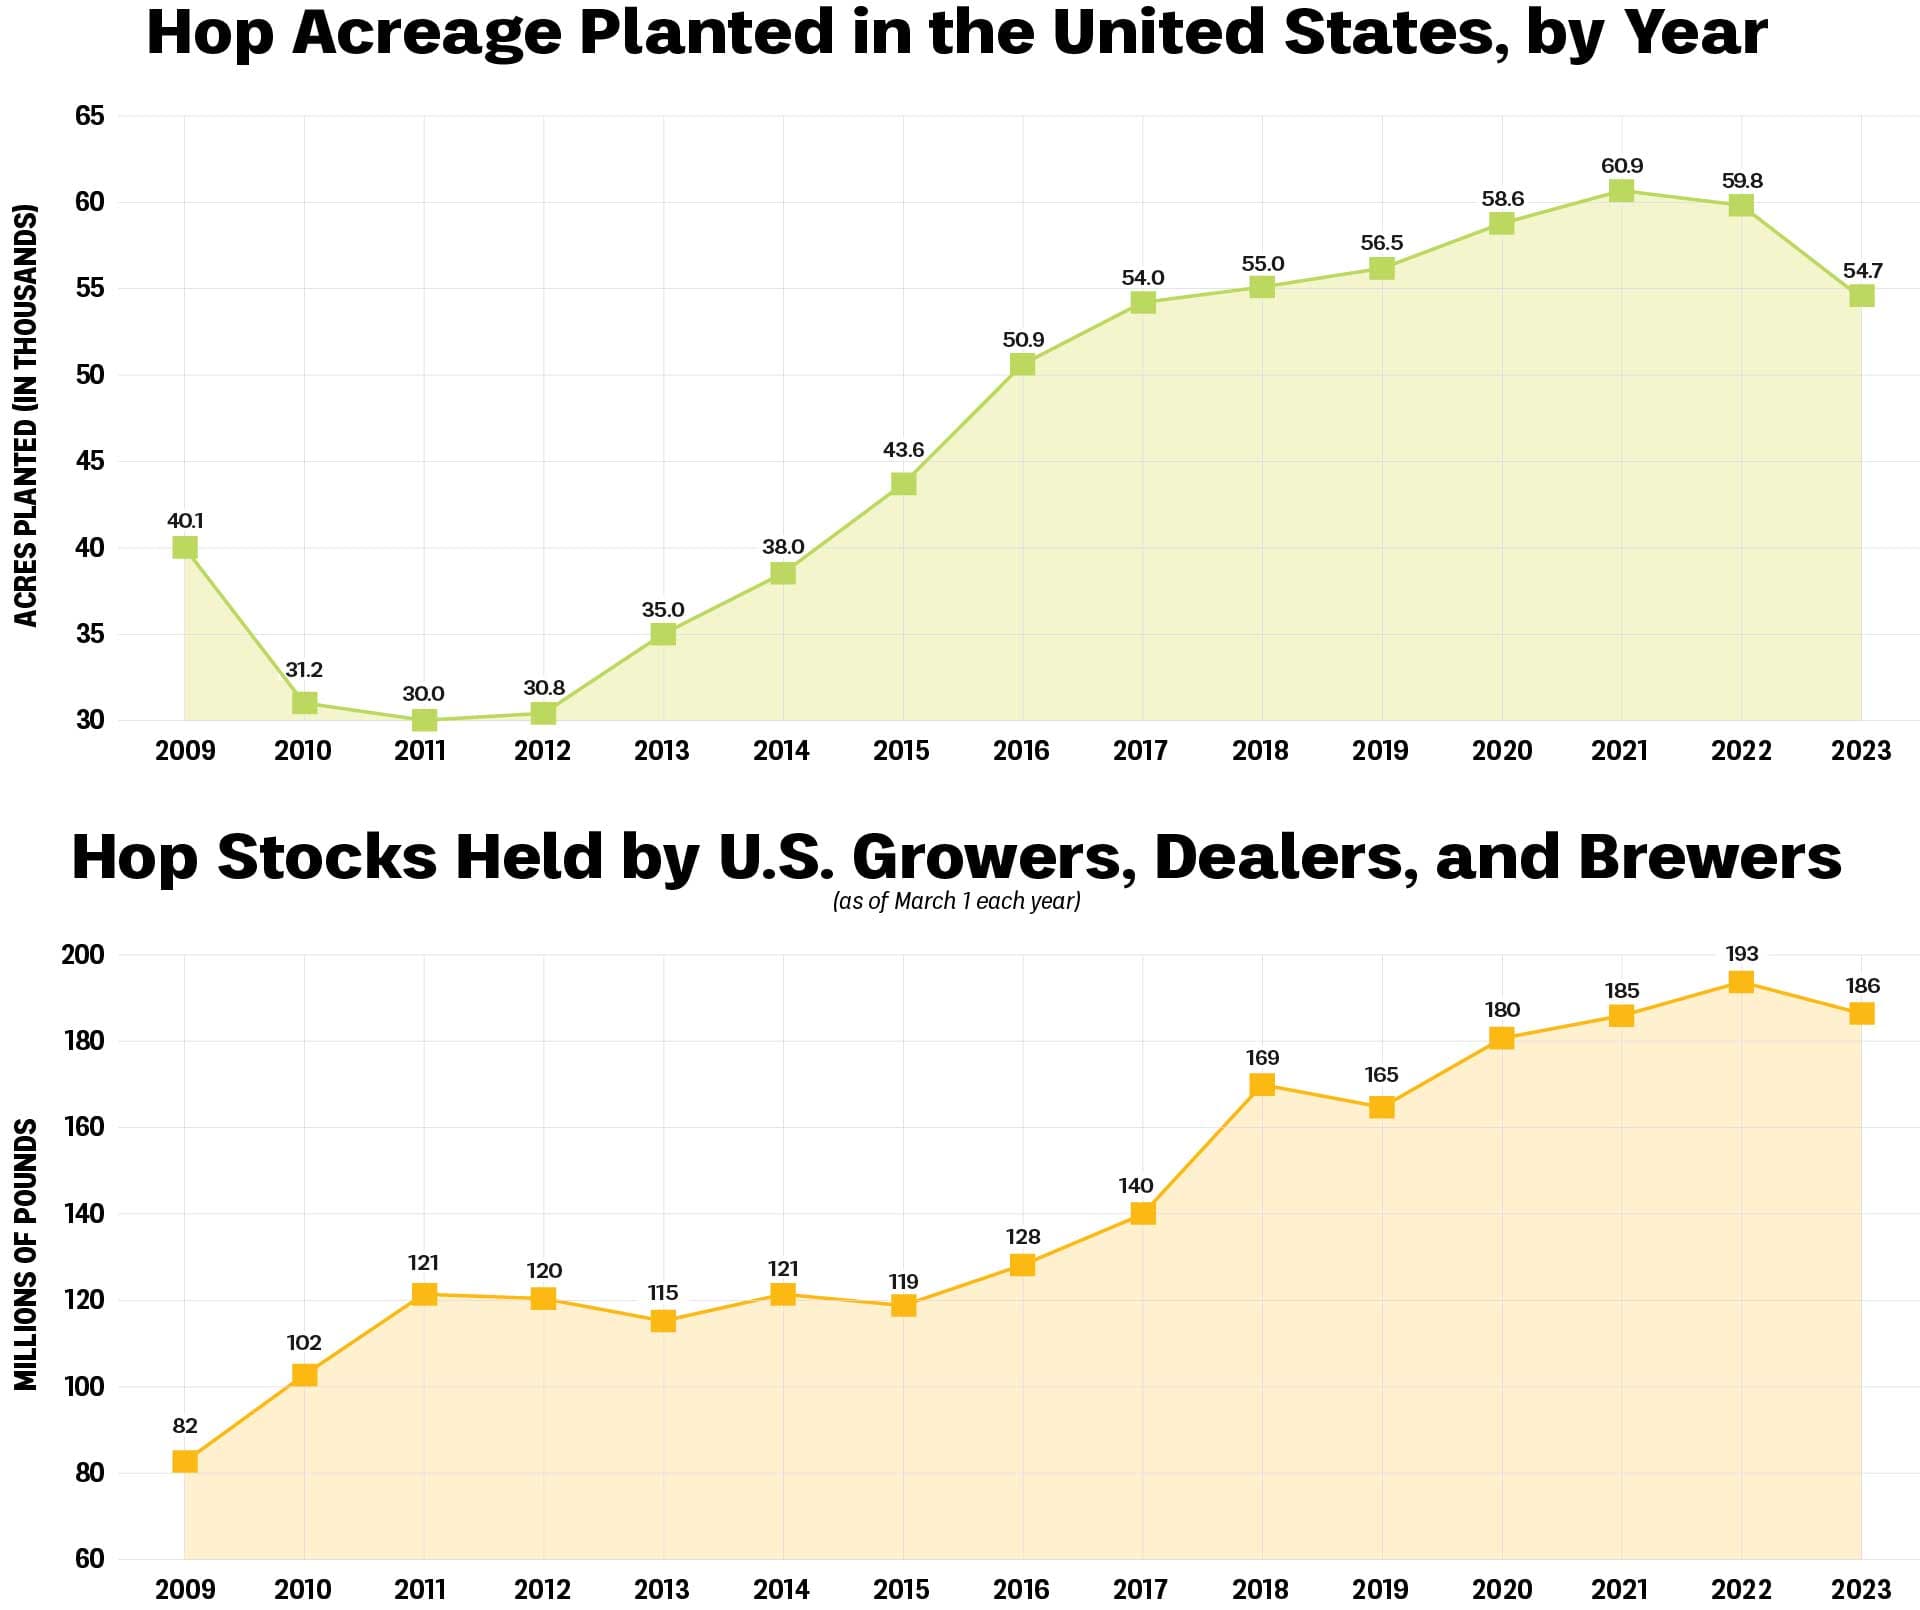
As hop growers and the brewing industry manage an ongoing hop surplus, farmers this year planted fewer acres. But will that mean fewer hops? Here, we sketch out the past 15 years of hop acreage, as well as hops kept in stock over that time.
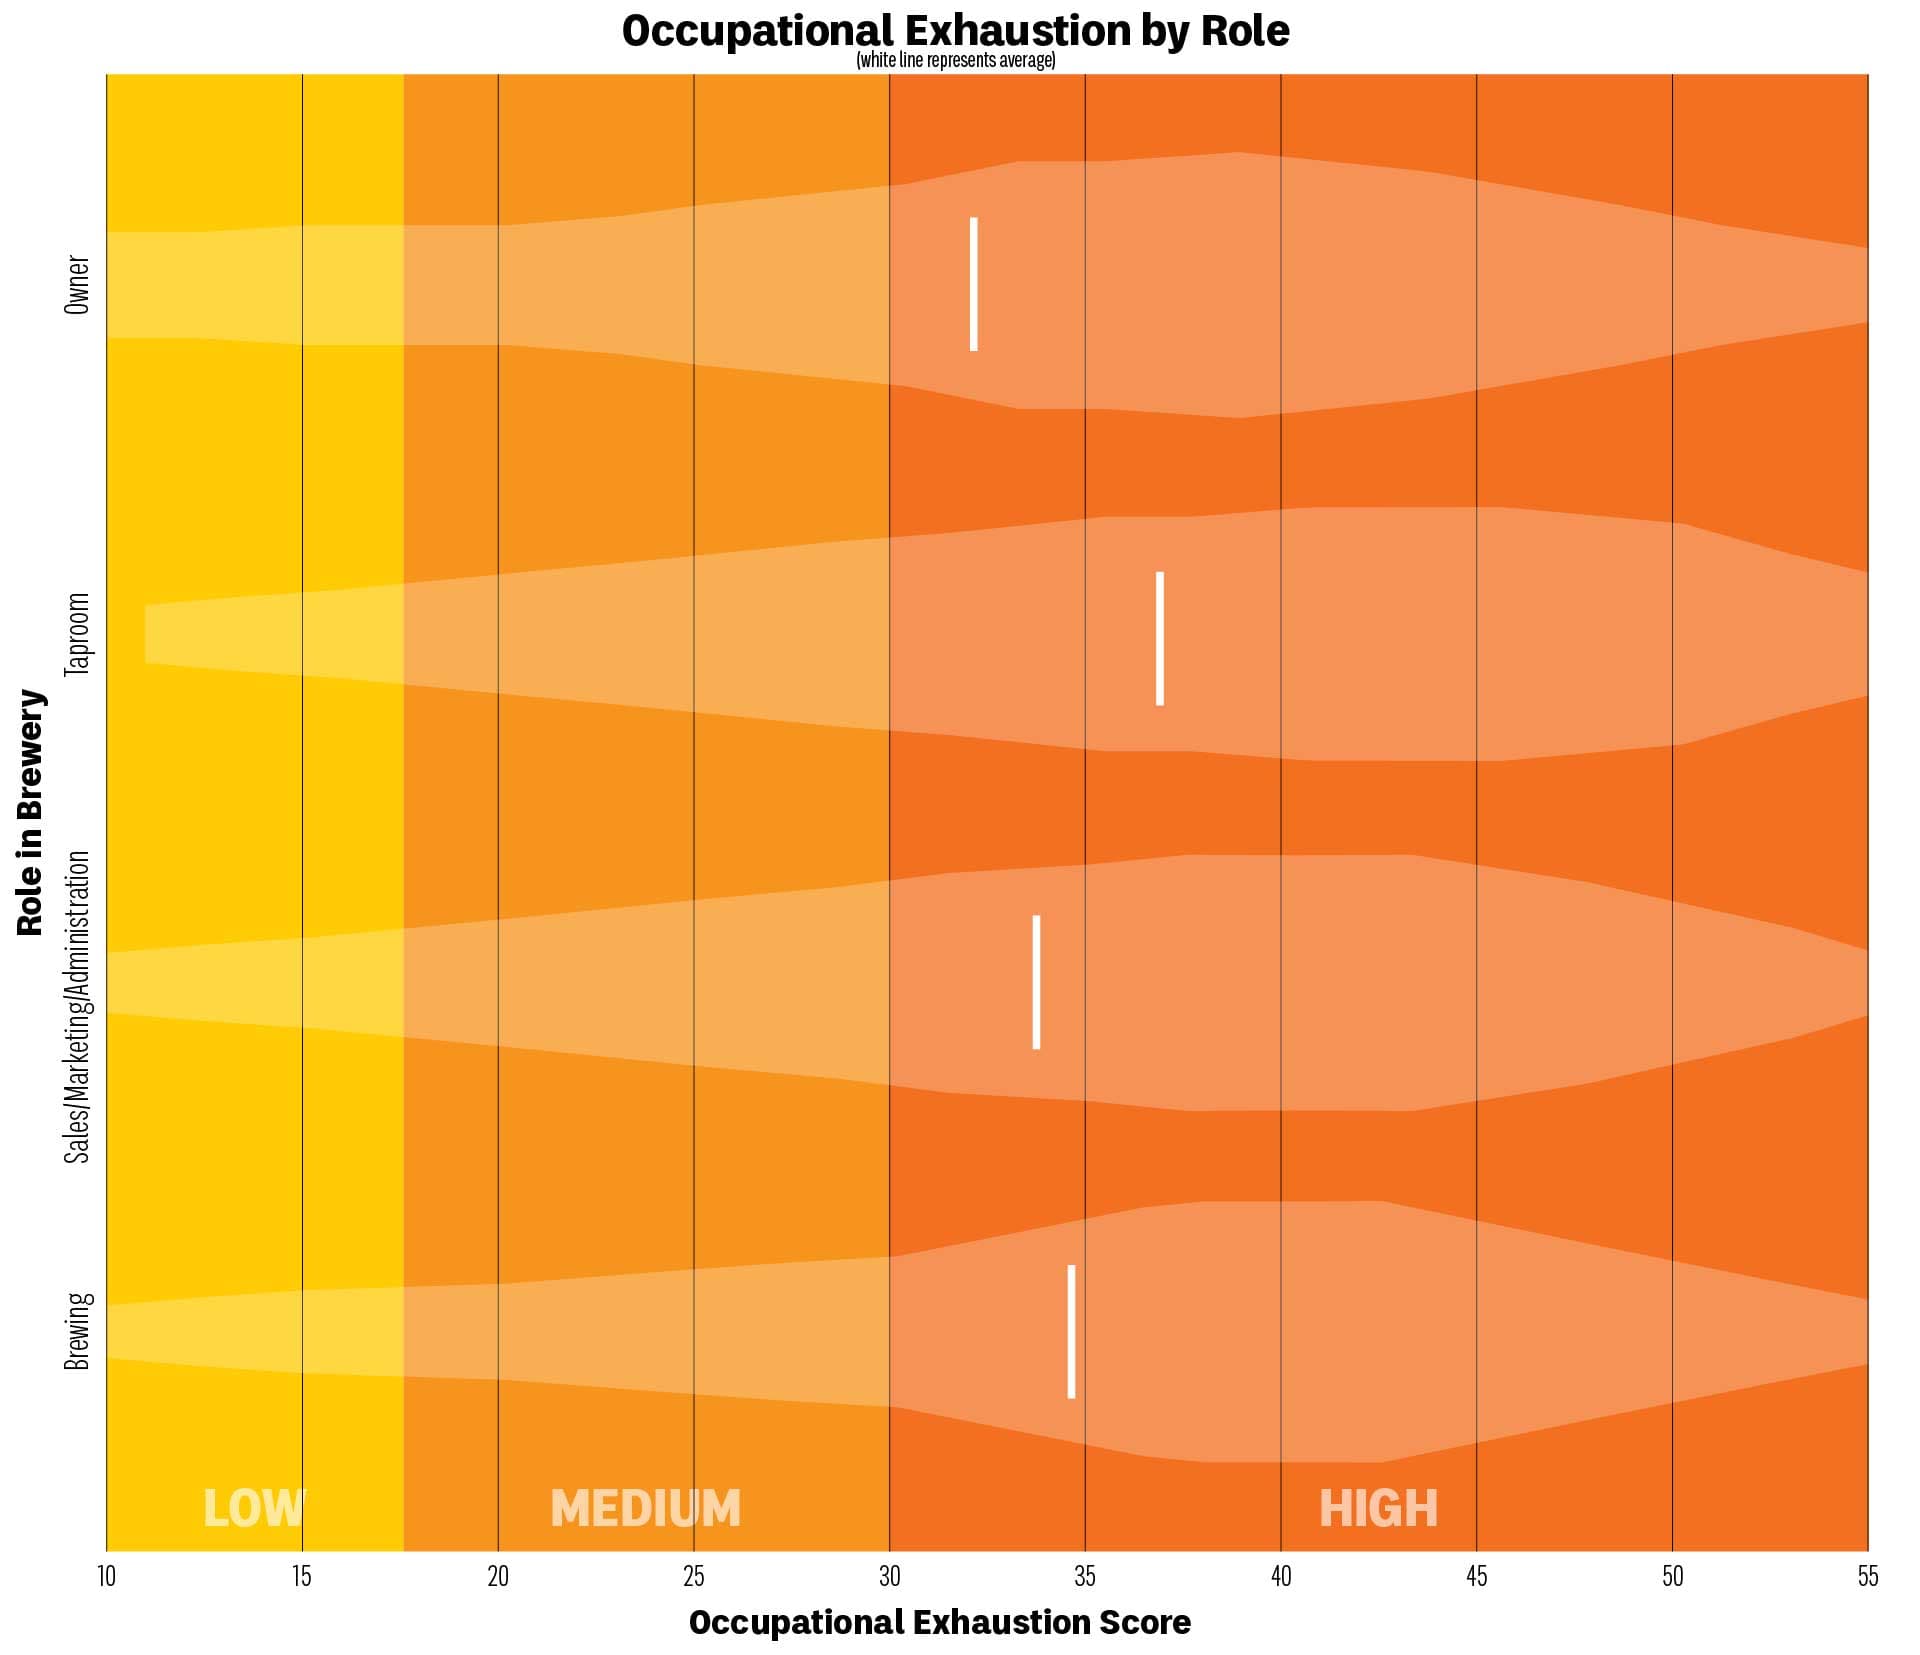
A recent survey found a high degree of occupational exhaustion among people who work various jobs in the brewing industry. Here we present the responses graphically as a violin plot.